
Inventory Ageing Analysis: Find the Stock That's Quietly Costing You
An inventory ageing analysis groups every SKU by how long it has sat unsold, so you catch slow movers while there is still time to act instead of finding out at stocktake. This walks through building the report from your own data, reading each ageing bucket, deciding what to do with each one — mark down, bundle, stop reordering, return to supplier — and keeping a live system flagging ageing stock automatically.
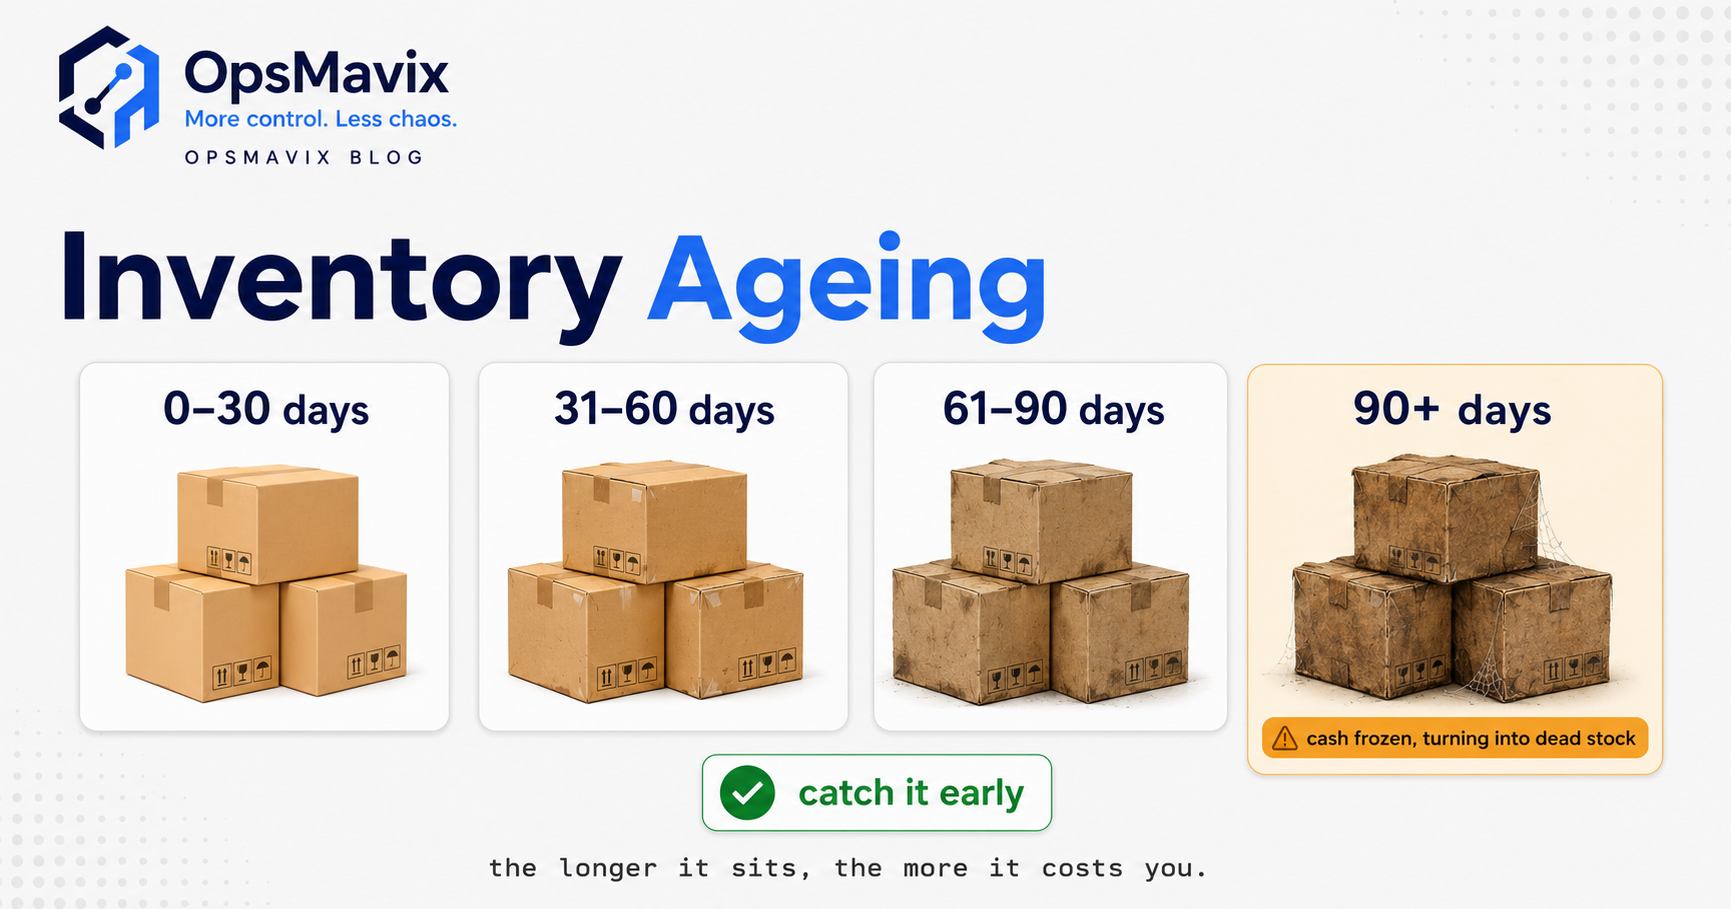
Quick summary: Inventory ageing analysis groups every item you hold into buckets by how long it has sat unsold — typically 0-30, 31-60, 61-90 and 90+ days — so you can see which stock is turning, which is slowing, and which has effectively stopped. You build it from data you already have (receipt or last-movement date, quantity on hand, unit cost), read each bucket as a signal, and act on it: keep reordering the fast stuff, mark down or bundle the slowing stuff, and stop reordering or return the stalled stuff before it becomes dead stock. The lasting fix is a system that flags ageing stock the moment it crosses a threshold, so you act at day 60 instead of discovering the problem at the annual count.
Ageing is the early-warning method. Dead stock is what you get when nobody ran it. The two topics are close enough to be confused, so this page is deliberately the ageing side — the report you run monthly to catch stock before it stalls — and the end state it prevents is the hub, dead stock management, which this hangs under. If your stock has already gone dead, start there; if you want to stop it going dead, stay here.
The worked figures throughout are illustrative. The point is the method and the arithmetic, not the numbers.
Table of contents
- What inventory ageing analysis actually is
- Why ageing beats waiting for the stocktake
- The data you need (you already have it)
- How to build the ageing report, step by step
- How to read each ageing bucket
- What to do with each bucket
- Worked example: £48k on the shelf, read by bucket
- The mistakes that make an ageing report lie
- From a monthly report to a live flag
- FAQ
What inventory ageing analysis actually is
Inventory ageing analysis answers one question for every SKU you hold: how long has this stock been sitting? You take each item’s age — measured from when it arrived, or from when it last moved — and drop it into a time bucket. The standard buckets are:
- 0-30 days — fresh, recently received or recently selling.
- 31-60 days — normal for most catalogues; watch, don’t panic.
- 61-90 days — slowing; this is where you intervene.
- 90+ days — stalled; on its way to dead unless you act, and often broken out further into 90-180 and 180+.
The output is a table: buckets down the side, and for each bucket the number of SKUs, the units held, and — the number that matters — the value of stock sitting in it. That last column turns “we have some old stock” into “£11,300 is frozen in items nobody has bought in three months”, which is a sentence that gets a decision made.
It is the same discipline accountants use for aged debtors, pointed at stock instead of invoices. An aged-debtor report tells you which money owed to you is going stale; an inventory ageing report tells you which money you spent is going stale on a shelf. Both exist to make you act before the number becomes a write-off.
Ageing is a cash lens, not a sales-value lens. It does not care what a SKU sells for or how profitable it is — those are the jobs of ABC analysis for inventory and GMROI. Ageing cares only about time: how long has this cash been immobilised as stock. That single-mindedness is its strength. A SKU can be high-margin, high-revenue and still be quietly rotting in the 90+ bucket, and only the ageing view catches it.
Why ageing beats waiting for the stocktake
Most businesses discover their slow stock exactly once a year, at the count, when someone stands in front of a shelf of product that was received eleven months ago and says “how long has this been here?” By then the options are bad: the item is obsolete, the season is over, the supplier won’t take it back, and the only exit is a deep markdown or the skip.
The reason ageing is worth running monthly is that the cost of slow stock compounds silently and the exit options narrow with time. While a single stalled SKU sits, it freezes cash you cannot spend on stock that would sell, occupies a location that gets counted and insured, loses value to obsolescence and deterioration, and — the cost hardest to see on a P&L — represents the sales you didn’t make because your working capital was tied up in the wrong SKUs.
Here is the part that makes early detection non-negotiable: exit value falls as age rises. At 60 days a slowing item might clear at 10% off, or bundle with a fast seller at full effective margin, or go back to the supplier under return terms. At 300 days the same item clears at 60% off if at all. Catching it in the 61-90 bucket instead of the 90+ bucket is often the difference between recovering most of your cost and recovering scrap. Ageing analysis is the routine that gets you to the decision while the decision is still cheap.
The data you need (you already have it)
You do not need new systems to build a first ageing report. You need four fields per SKU, and every one already exists somewhere in your records:
| Field | What it is | Where it lives |
|---|---|---|
| Item / SKU | The unique product identifier | Stock list, product file |
| Quantity on hand | Units currently held | Stock system or last count |
| Unit cost | What you paid per unit (landed) | Purchase records, supplier invoices |
| Ageing date | Receipt date or last-movement date | Goods-in records, sales/movement log |
The one that decides everything is the ageing date, and there are two honest ways to set it, each with a trade-off:
- Receipt date (batch age). Age from when the stock arrived. Accurate for perishables and batch-tracked goods, and the strictest reading. Needs goods-in dates per batch, so it rewards businesses that already record receipts properly. This is where a clean goods receiving process pays off — no receipt date, no honest batch age.
- Last-movement date (dormancy). Age from the last time the SKU sold or moved. Easier if you don’t batch-track, and it answers “how long since anyone wanted this”, which is the dead-stock question. Its blind spot: a SKU that sells one unit a quarter looks perpetually fresh even while 200 units gather dust behind that one sale.
For most non-perishable businesses, last-movement date is the pragmatic start and receipt date is the upgrade once your goods-in data is trustworthy. Use unit cost, not sell price, for the value column — ageing measures cash exposure, and cash exposure is what you paid, ideally at landed cost so the number includes freight and duty rather than just the invoice line.
How to build the ageing report, step by step
You can build the first version in a spreadsheet in an afternoon. The steps are the same whether it lives in a spreadsheet or a system.
Step 1 — Pull the four fields for every SKU. Export SKU, quantity on hand, unit cost, and the ageing date. If you can’t export the ageing date per SKU, that gap is itself the first finding — it is precisely why nobody has run this before.
Step 2 — Calculate age in days. For each SKU, today − ageing date = age in days. If you batch-track and hold multiple receipts of the same SKU, calculate per batch, because half a SKU can be fresh and half can be a year old — averaging them hides the old half.
Step 3 — Assign a bucket. Map each age to 0-30, 31-60, 61-90, or 90+. Break 90+ into 90-180 and 180+ if you have any depth of slow stock; the difference between three months and a year is the difference between “mark down” and “write off”.
Step 4 — Value each line. quantity on hand × unit cost = value at risk for that SKU. This is the column that drives decisions.
Step 5 — Summarise by bucket. Sum SKU count, units, and value into each bucket. Now you have the headline: how much cash sits in each age band, and what share of your total stock value is 90+ days old. That single percentage — value in 90+ ÷ total stock value — is the health metric to track month over month.
Step 6 — Sort within the danger buckets. Inside 61-90 and 90+, sort by value, highest first. You act on the biggest cash exposures first; a £4,000 stalled SKU earns a decision before forty £15 ones. This is the same 80/20 logic as ABC analysis — focus effort where the money is.
The finished report is one table plus a sorted worklist of the SKUs in the two danger buckets. That worklist is the entire point: it is the list of decisions you need to make this month.
How to read each ageing bucket
A bucket is a signal, not a verdict. What “old” means depends on your turnover — a bucket that is alarming for fresh food is normal for industrial spares. Read them in context of your own inventory turnover ratio:
- 0-30 days — healthy flow. Stock arriving and moving. You want most of your value here. Nothing to do except keep the reorder going.
- 31-60 days — normal, with a watch. For most catalogues this is unremarkable. It becomes a signal only if a SKU that used to clear in 30 days is now sitting to 60 — that is the earliest warning of a slowdown, visible only if you compare months.
- 61-90 days — the intervention window. This is the bucket the whole exercise exists for. Stock here is slowing but still has decent exit options. Act now and you recover most of your cost. Ignore it and it rolls into 90+ next month with fewer options.
- 90+ days — stalled, becoming dead. Cash is now meaningfully frozen. Exit value is falling. Anything here needs an active decision — not “keep an eye on it”, an actual choice with a date. Stock that reaches 180+ is functionally dead stock and should be treated as a loss to minimise, not an asset to hold.
The trap is reading a single month in isolation. A SKU sitting at 45 days tells you little; a SKU that has climbed from 20 to 45 to 70 across three months is a moving object heading for the danger zone, and that trajectory only shows up if you run the report on a cadence and compare. The direction of travel matters more than the snapshot.
What to do with each bucket
An ageing report that produces no action is just anxiety in a table. Each bucket maps to a default play. The decision framework:
| Bucket | Default action | Why |
|---|---|---|
| 0-30 | Keep reordering | Healthy; protect availability |
| 31-60 | Watch trend; check reorder point | Catch a slowdown before it deepens |
| 61-90 | Intervene: promote, bundle, or slow reorder | Exit options still good; recover most cost |
| 90+ | Actively clear: mark down, bundle, return, liquidate | Cash frozen; minimise the loss |
| 180+ | Write off / dispose | Holding costs now exceed likely recovery |
The specific levers, roughly in order of how much value they preserve:
- Stop or slow the reorder first. The cheapest fix is not buying more of something that isn’t selling. Before any markdown, check whether the SKU is still on an automatic reorder and turn it off. Slow stock that is still being replenished is a self-inflicted wound — and it usually means the demand forecast driving the reorder is stale and needs correcting, not just overriding once.
- Return to supplier. If your purchase terms allow returns of unsold or overstocked goods, this is the best recovery — you get cash or credit near cost. Check the terms before you discount; a return at 90% beats a markdown at 60%.
- Bundle with a fast mover. Attach the slow SKU to something that is selling, as a kit or a “free with” offer. You move the dead unit at little or no discount to your blended margin, because the fast SKU carries the deal. Often better than a straight markdown.
- Mark down, in steps. Discount to clear, but in stages — 10%, then 25%, then 40% — rather than one deep cut, so you don’t give away margin you didn’t need to. The ageing report tells you which SKUs have run out of time for a gentle first step.
- Liquidate or dispose. For 180+ stock with no other exit, sell to a jobber, donate for the tax treatment, or dispose and reclaim the space. A slot earning nothing is costing you; recovering the location can be worth more than the scrap value of the stock in it.
The discipline that makes this stick: every SKU in the 90+ bucket gets a decision and a date, not a vibe. “Mark down 25% by Friday”, “returned to supplier this week”, “bundled with SKU-X from Monday”. A bucket full of items you keep meaning to deal with is how 90 days becomes 300.
Worked example: £48k on the shelf, read by bucket
Take a small wholesaler holding £48,000 of stock at cost across 600 SKUs. They run their first ageing report on last-movement date. It comes out like this:
| Bucket | SKUs | Value at cost | % of stock value |
|---|---|---|---|
| 0-30 days | 210 | £22,600 | 47% |
| 31-60 days | 150 | £12,100 | 25% |
| 61-90 days | 90 | £6,800 | 14% |
| 90-180 days | 90 | £4,900 | 10% |
| 180+ days | 60 | £1,600 | 4% |
The headline: £6,500 (14%) is 90+ days old and heading for dead, and another £6,800 is in the intervention window right behind it. Before this report, the owner’s mental model was “stock’s a bit high but it’s all moving”. It isn’t — one pound in seven has effectively stopped.
Now they work the danger buckets by value, biggest first. Inside 90-180 days, three SKUs account for £3,100 of the £4,900:
- A discontinued packaging variant, £1,400. Supplier accepts returns within 12 months — it’s at 5 months. Action: return to supplier this week. Recovers ~£1,300 of £1,400.
- A slow accessory, £1,000, still on auto-reorder. It’s been quietly replenishing itself. Action: turn off the reorder, bundle it free with its matching fast-selling base unit. Clears the units at blended full margin; stops the bleed.
- A seasonal line, £700, out of season for 8 months. No return, no bundle fit. Action: mark down 25% now, 40% in three weeks if unmoved. Recovers what it can before it ages further.
Three decisions, made in ten minutes off a sorted list, address £3,100 of frozen cash — most of it recovered near cost — and stop the reorder that was making one line worse. The remaining long tail of small-value old SKUs gets a batch markdown rather than individual attention, because it isn’t worth more time than that. That is the whole value of the report: it turned a vague unease into three specific, dated, money-recovering actions and told the owner which ones not to bother with.
The mistakes that make an ageing report lie
An ageing report is only as honest as the data under it. The failures that make it mislead:
- Averaging batches. Reporting one age per SKU when you hold several receipts hides the old half behind the new half. A SKU showing “40 days” can be half fresh and half a year old. Age per batch, or per receipt, wherever you track them.
- Using sell price instead of cost. Valuing the buckets at retail inflates the numbers and confuses the cash question. Ageing measures what you spent and can’t get back — use cost, ideally landed.
- Wrong ageing date. Last-movement date makes a trickle-selling SKU look eternally fresh while a pile sits behind the odd sale. If a SKU sells rarely but in tiny quantities against a big holding, cross-check it against receipt date.
- Ignoring the reorder point. An ageing report that flags a slow SKU while the system keeps reordering it is closing a tap you left running. Ageing findings should feed back into your reorder settings and demand forecast, not just trigger one-off markdowns.
- Running it once. A single ageing report is a snapshot; the value is in the trend. Direction of travel — SKUs climbing through the buckets month over month — is the early warning, and it only exists if you run it on a fixed cadence.
- Counting inaccuracy underneath it all. If your quantity-on-hand is wrong, every value in the report is wrong. Ageing analysis assumes your stock records match reality, which is a job for a running inventory cycle count — without it, you’re ageing numbers that don’t reflect the shelf.
From a monthly report to a live flag
The spreadsheet version works, and you should build it — running the report by hand once teaches you what the buckets mean. But the manual report has a structural flaw: it tells you the state on the day you happened to run it. Between runs, stock keeps ageing silently, and the SKU that crossed from 89 to 91 days the day after your monthly export sits unnoticed for another month. The report is retrospective; the cost is continuous.
The fix is to move the logic off the spreadsheet and into the system that already holds your stock and movement data, so ageing is computed continuously and flags itself the moment a SKU crosses a threshold. Concretely, an owned operations system that knows your receipts, movements and costs can:
- Age every SKU in real time against its receipt or last-movement date, so the report is a live view you open, not a fortnightly export you build.
- Raise a flag at the threshold — a SKU crossing into 61-90, or 90+, or a batch approaching a return-window expiry — so you act on the day it slows, not at the next stocktake.
- Catch the return window before it closes. The biggest recovery — returning stock to the supplier near cost — is time-limited, and a live system can warn you before the window shuts rather than after.
- Feed ageing back into reordering. A SKU flagged as slowing can automatically hold or reduce its own reorder, so you stop replenishing dead stock without a human noticing first.
- Show the trend, not just today. Track each bucket’s value month over month and each SKU’s trajectory through the buckets, so the direction of travel is visible without rebuilding history each time.
None of that needs a full ERP. It needs the ageing calculation to live next to the movement data that drives it, inside a right-sized operations system — the kind of thing that belongs in a fully automated inventory system rather than in a monthly manual ritual. That is the whole difference between ageing analysis as a habit and ageing analysis as a safeguard: the habit depends on you remembering; the safeguard doesn’t.
FAQ
What is inventory ageing analysis?
It is the practice of grouping every item you hold into time buckets — typically 0-30, 31-60, 61-90 and 90+ days — by how long the stock has sat unsold, then valuing each bucket at cost to see how much cash is frozen in stock that isn’t moving. It is the early-warning method for catching slow stock before it becomes dead stock, and it works from data you already have: SKU, quantity on hand, unit cost, and a receipt or last-movement date.
What ageing buckets should I use?
The standard four are 0-30, 31-60, 61-90 and 90+ days, with 90+ often split into 90-180 and 180+ if you carry any depth of slow stock. Fast-turning businesses (fresh food, fashion) may want tighter bands like 0-15 and 15-30; slow-turning ones (industrial spares) may stretch them. Set the bands relative to your own turnover — a “slow” age is one meaningfully longer than how fast that category should normally clear.
Should I age stock from receipt date or last-movement date?
Receipt date (batch age) is stricter and correct for perishables and batch-tracked goods, but needs reliable goods-in dates. Last-movement date (dormancy) is easier if you don’t batch-track and directly answers “how long since anyone bought this”, but it can make a SKU that sells one unit a quarter look perpetually fresh while a pile sits behind that trickle. For most non-perishable businesses, start with last-movement date and upgrade to receipt date once your goods-in data is trustworthy.
How is inventory ageing different from dead stock management?
Ageing is the early-warning method; dead stock is the end state it exists to prevent. Ageing analysis is the routine report you run monthly to catch stock while it is merely slowing and still has good exit options. Dead stock management is what you do once stock has already stalled and the goal shifts to minimising a loss. Run ageing well and you have far less dead stock to manage.
How often should I run an ageing report?
Monthly for most businesses, more often if you turn stock fast or hold perishables. The value is less in any single report than in the trend across them — a SKU climbing from 30 to 60 to 90 days over three months is the signal you’re looking for, and that trajectory only appears if you run the report on a fixed cadence and compare. Running it once a year, at the stocktake, is exactly the failure ageing analysis exists to fix.