
Economic Order Quantity (EOQ): The Formula, a Worked Example, and Its Limits
Economic order quantity is the order size that makes the total of your ordering costs and your holding costs as small as possible. This is the formula with every term explained, a worked example in £, how EOQ answers 'how much' while your reorder point answers 'when' — and, more usefully, the four assumptions that make textbook EOQ wrong for most small businesses and how to use it anyway.
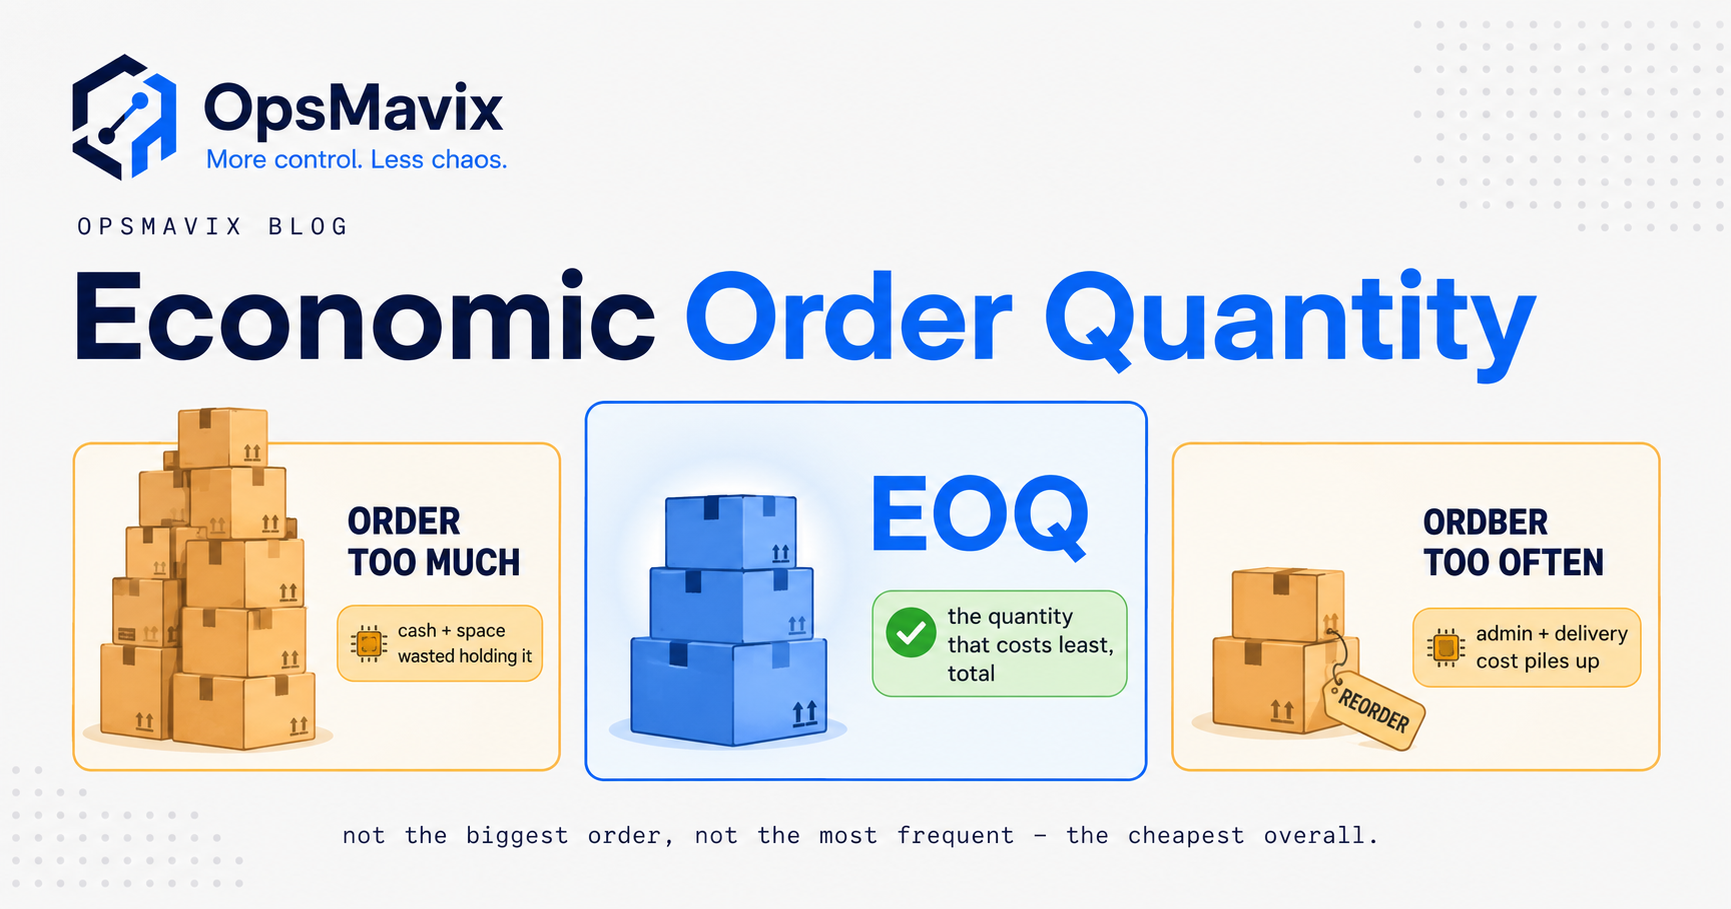
Quick summary: Economic order quantity (EOQ) is the order size that minimises the sum of two costs that pull in opposite directions — the cost of placing orders, which falls the more you buy at once, and the cost of holding stock, which rises the more you buy at once. The formula is EOQ = √(2 × annual demand × cost per order ÷ annual holding cost per unit). It tells you how much to order; your reorder point tells you when. In a real small business the textbook number is rarely the number you actually order, because EOQ assumes steady demand, fixed costs and no supplier minimums — so most people use it as a sanity check on quantities they already order, not as a rule.
EOQ is one of the oldest formulas in inventory management, and it is on every supply-chain glossary because it is genuinely useful for one narrow thing: settling the argument between ordering little-and-often and ordering big-and-rarely. This page gives you the formula with each term explained, a worked example you can copy in pounds, the relationship between EOQ and your reorder point, and — the part the glossaries skip — the four places EOQ quietly breaks when you try to run a real stockroom off it.
On this page
- What economic order quantity actually is
- The EOQ formula, with every term explained
- A worked example in pounds
- EOQ answers “how much”, reorder point answers “when”
- Where EOQ breaks in a real small business
- How to actually use EOQ: as a sanity check, not a rule
- EOQ, reorder point and min/max together
What economic order quantity actually is
Every time you buy stock you pay for it twice. Once obviously — the invoice from the supplier. And twice quietly, in two costs that most businesses never separate:
- Ordering cost. The work and money it takes to place and receive one order, regardless of size. Someone raises the purchase order, chases the supplier, checks the delivery, matches the invoice. There may be a carriage charge or a small-order fee. This cost is roughly the same whether the order is for 50 units or 500, which is the whole point.
- Holding cost. What it costs to have stock sitting on a shelf for a year. Warehouse space, insurance, the money tied up that you could have used elsewhere, plus the risk that the stock is damaged, stolen or goes out of date. This is usually expressed as a percentage of the item’s value per year.
These two costs fight each other. Order in big batches and your ordering cost per unit drops — you place fewer orders a year — but your holding cost climbs, because on average you are sitting on more stock. Order little and often and holding cost falls but ordering cost rises. Somewhere between “one giant order a year” and “a tiny order every day” is the quantity where the two costs added together are at their lowest.
That quantity is the economic order quantity. It is not the cheapest order, or the biggest discount, or the amount that fills the van. It is the order size where the total annual cost of ordering plus holding is minimised. Everything else in this page is either how to calculate it or why that single-minded definition needs handling with care.
The EOQ formula, with every term explained
The classic formula — sometimes called the Wilson formula after the man who popularised it — is:
EOQ = √( 2 × D × S ÷ H )
Three inputs, and the whole thing lives or dies on how honestly you estimate them.
- D — annual demand, in units. How many of this item you sell or consume in a year. Use actual units shipped over the last twelve months if you have them, not a forecast, unless demand is clearly trending.
- S — cost per order (the “setup” or ordering cost), in £. The fully-loaded cost of placing and receiving one order of this item: the staff time to raise the PO, chase, receive and match it, plus any fixed carriage or small-order charge. Not the cost of the goods — that cancels out and does not belong here.
- H — annual holding cost per unit, in £. What it costs to hold one unit for a year. Usually calculated as the unit cost × a holding-cost rate. The rate bundles storage, capital, insurance and obsolescence and, for most SMBs, lands somewhere around 20–30% of the item’s value a year. So a £40 item at a 25% rate has H = £10.
The 2 is not magic — it falls out of the calculus that finds the low point of the total-cost curve. You do not need the derivation to use the formula; you need to know that the square root is why EOQ is less sensitive to your inputs than you would fear. Double your ordering cost estimate and EOQ only rises by about 41% (√2), not 100%. That forgiveness is important later, because your inputs will be rough.
A quick sanity note on units: D is per year, H is per unit per year, S is per order. Keep the time basis consistent — annual throughout — and the answer comes out in units per order.
A worked example in pounds
Take a single product. A homeware business sells a £40 stoneware mug set as a steady line.
| Input | Symbol | Value |
|---|---|---|
| Annual demand | D | 3,600 units |
| Cost per order | S | £45 |
| Unit cost | — | £40 |
| Holding-cost rate | — | 25% per year |
| Annual holding cost per unit | H | £40 × 25% = £10 |
Plug in:
EOQ = √( 2 × 3,600 × 45 ÷ 10 ) = √( 324,000 ÷ 10 ) = √32,400 ≈ 180 units.
So the economic order quantity is about 180 units. What does that actually buy you? Order in 180s and you place 3,600 ÷ 180 = 20 orders a year, one roughly every 2.5 weeks. Let us check the two costs at that quantity:
- Annual ordering cost = 20 orders × £45 = £900.
- Annual holding cost = average stock (half of 180 = 90 units) × £10 = £900.
Notice they are equal — £900 and £900. That is not a coincidence; at the EOQ, annual ordering cost and annual holding cost are always equal, and their total (£1,800 here) is the lowest achievable. It is a useful gut check: if you calculate an EOQ and the two costs come out wildly different, you have made an arithmetic error.
Now compare against a habit-based order size. Suppose the buyer currently orders 600 at a time “because the supplier likes round pallets”:
- Ordering cost = (3,600 ÷ 600) × £45 = 6 orders × £45 = £270.
- Holding cost = 300 average units × £10 = £3,000.
- Total = £3,270 — versus £1,800 at EOQ. Ordering in 600s costs an extra £1,470 a year on this one line, almost all of it buried in holding cost nobody sees on an invoice.
That gap is what EOQ is for: exposing the quiet cost of a batch size chosen by habit. Whether you should actually order 180 is a separate question — and the rest of this page is that question.
EOQ answers “how much”, reorder point answers “when”
The single most common confusion is treating EOQ as if it told you when to buy. It does not. EOQ and reorder point answer two completely different questions, and you need both:
- EOQ = how much to order in one go. A quantity.
- Reorder point = when to place that order — the stock level that, when you hit it, triggers a purchase. A trigger.
They are independent. Your reorder point is set by how fast you sell and how long the supplier takes to deliver, plus a safety cushion — that is worked through in full in how to calculate reorder point, and the operating discipline around it in what a reorder point system is. EOQ says nothing about lead time or demand variability; it only weighs ordering cost against holding cost to size the batch.
Put together, the pair reads like this for the mug set: “When stock drops to [reorder point] units, order 180.” The reorder point protects you from running out during the lead time; the EOQ decides how big the resulting order is. Getting one right and the other wrong still hurts — a perfect reorder point that triggers a wastefully large order still bleeds holding cost, and a perfect EOQ that triggers too late still stocks you out. The safety-stock half of the reorder point — the buffer against demand and lead-time wobble — has its own method in safety stock calculation, and it is worth keeping mentally separate from EOQ, because EOQ assumes that wobble away entirely. Which is the next problem.
Where EOQ breaks in a real small business
Here is what the glossary pages leave out. EOQ is built on four assumptions, and in a real small business at least one of them is usually false. This is not a reason to ignore EOQ — it is the reason to treat its output as an opinion rather than an instruction.
1. It assumes demand is steady and known
The formula uses a single annual demand figure and quietly assumes stock is consumed at a smooth, constant rate all year. Real demand is lumpy — seasonal peaks, a big trade order, a slow August. If your demand swings hard, the “average” EOQ is a batch size for a year that never happens. For seasonal or spiky lines you are better off sizing orders to the season, and getting the demand picture right first — see demand forecasting for a small business. EOQ is at its best on steady, boring, always-on stock.
2. It ignores minimum order quantities and bulk breaks
EOQ says order 180. The supplier sells in cases of 144 and gives a 7% discount at 500. Now the “economic” quantity is unbuyable at the price you assumed, and the real decision is between 288 (two cases) and 500 (discount). Basic EOQ has no concept of a minimum order quantity or a price break — there are extended versions that handle quantity discounts, but the honest move in a small business is usually to calculate plain EOQ, then round to the nearest buyable quantity and check whether a discount tier is close enough to be worth the extra holding cost. In the worked example, jumping to 500 for a 7% discount saves £40 × 3,600 × 7% = £10,080 on goods but adds roughly £1,200 in holding cost — an easy yes. EOQ did not tell you that; it just gave you the baseline to judge it against.
3. It treats ordering and holding costs as fixed and knowable
Very few SMBs actually know their cost per order or their holding-cost rate. They are estimates, sometimes wild ones. The saving grace is the square root: because EOQ scales with the square root of those inputs, a 50% error in your ordering cost moves EOQ by only about 22%. So you do not need precision — a defensible ballpark for S and H is enough to get an EOQ that is in the right area. It does mean the exact number is false confidence. Treat 180 as “somewhere around 150–220”, not as gospel.
4. It optimises one item in isolation
EOQ looks at one SKU as if it were the only thing you buy. But you place orders with suppliers, not SKUs, and consolidating ten items onto one supplier PO changes the ordering-cost maths for all of them. You also have a total cash and shelf-space budget that EOQ knows nothing about — the per-item optimum can add up to more stock than you can afford or store. This is why EOQ pairs badly with a naïve “calculate it for every SKU” rollout and pairs well with prioritisation: run the numbers properly on the lines that matter, using something like ABC analysis to decide which those are, and leave the long tail on simpler rules.
One more, quieter point: the holding-cost rate should arguably include your true landed cost per unit, not just the sticker price — duty, freight and handling all inflate the value you are tying up. If you import, getting H right means getting landed cost right first.
How to actually use EOQ: as a sanity check, not a rule
Given all four caveats, what do experienced buyers do with EOQ? They use it as a challenge to habit, not as a daily instruction. A practical workflow:
- Calculate plain EOQ for your high-value, steady lines. Not everything — the A-items and steady B-items where getting batch size wrong costs real money.
- Compare it to what you order now. If your current batch is within roughly ±30% of EOQ, leave it alone; the total-cost curve is flat near the bottom, so the difference is not worth the disruption. This flatness is EOQ’s most under-appreciated feature — being approximately right is nearly as cheap as being exactly right.
- Only act on the big gaps. When current practice is 3× or ⅓ of EOQ — like the 600-vs-180 mug example — that is a genuine leak worth fixing.
- Round to a buyable quantity. Nearest case, pallet or MOQ, and check whether a nearby discount tier changes the answer.
- Re-check when the inputs move. A big change in demand, unit cost, storage cost or supplier terms can shift EOQ enough to matter. Once or twice a year is plenty for most lines.
Used this way, EOQ earns its keep. It is a lens that makes an invisible cost — holding — visible enough to argue with, and it settles the perennial “should we buy in bulk?” debate with a number instead of a hunch. What it is not is an autopilot. The businesses that get burned are the ones that wire the raw EOQ straight into automatic purchasing and wake up to a stockroom full of per-item optima that nobody can afford or shelve.
EOQ, reorder point and min/max together
EOQ does not replace your reordering logic; it slots into it. The three ideas layer cleanly:
| Question | Tool | What it decides |
|---|---|---|
| When do I order? | Reorder point | The stock level that triggers a purchase, covering lead time plus safety stock |
| How much do I order? | Economic order quantity | The batch size that minimises ordering + holding cost |
| What are my floor and ceiling? | Min/max | The lowest stock I tolerate and the highest I am willing to hold |
In practice most small businesses do not run pure EOQ at all. They run a min/max inventory system — order up to a max when stock hits a min — and use EOQ to set the gap between min and max sensibly rather than plucking it from the air. The min is your reorder point; the max is min plus roughly one EOQ. That is the honest reconciliation of the textbook and the stockroom: EOQ informs the numbers, the reorder-point and min/max systems do the actual triggering, and a human still overrides all of it when a supplier changes terms or a season lands.
If any of those three numbers are currently set by feel — batch sizes by habit, reorder points by memory, no max at all — that is exactly the kind of quiet, compounding cost that an inventory automation system is meant to take off your plate, calculating and re-checking them from your real sales and lead-time data instead of leaving them frozen at whatever felt right two years ago.
EOQ is worth knowing precisely because it is simple, old and slightly wrong. The formula gives you a fast, defensible answer to “how much should I order?” — and the discipline is knowing when the four assumptions behind it hold, rounding to reality when they do not, and never mistaking a tidy square root for the last word on how your stockroom should run.