
Inventory Shrinkage: What It Is, What Causes It, and How to Cut It
Inventory shrinkage is the gap between the stock your records say you own and the stock you actually have — units you paid for but cannot sell. This is the practical guide: the shrinkage-rate formula worked through in £, the real causes (theft, admin error, damage, supplier short-shipment, miscounts), how to measure it honestly, and how to cut it with accurate stock records, disciplined cycle counts and ABC focus on the high-value lines. It also draws the line most articles blur: shrinkage is the loss, a stock discrepancy is the count mismatch that reveals it.
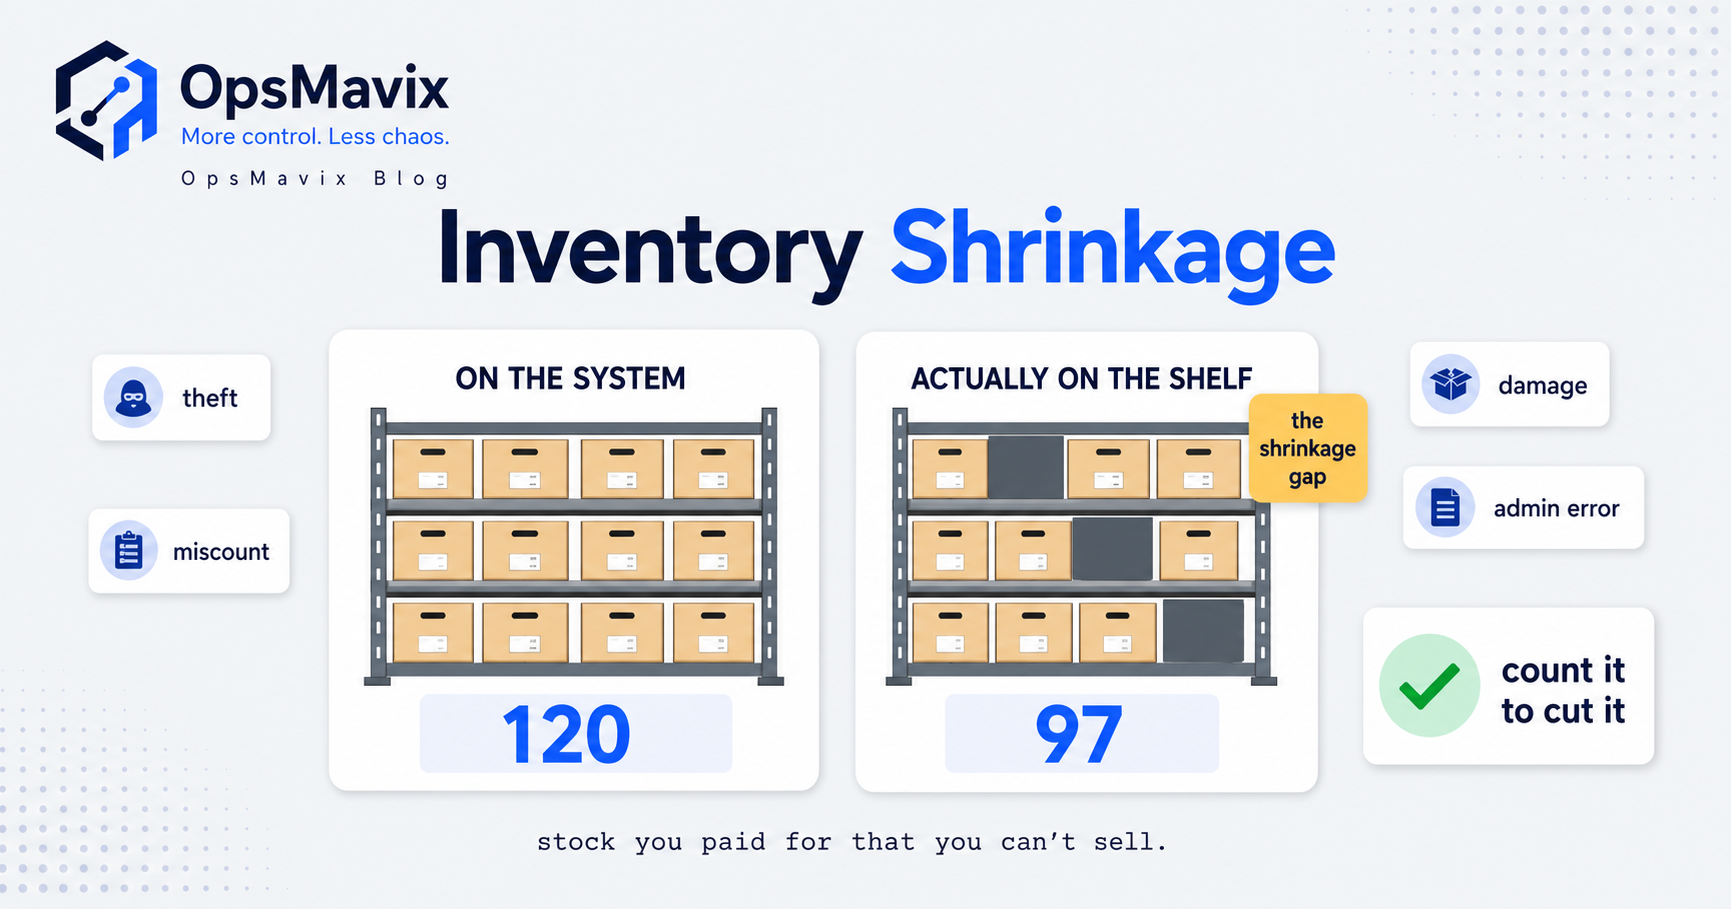
Quick summary: Inventory shrinkage is the difference between the stock quantity your records say you hold and the quantity actually on the shelf — inventory you have paid for but can no longer sell. You measure it as a shrinkage rate: the cost value of the missing stock divided by the cost value of stock sold or held over a period, expressed as a percentage. The real causes are theft, administrative and booking errors, damage and spoilage, supplier short-shipments, and plain miscounts — and in most growing businesses paperwork error, not theft, is the largest share. You cut it by keeping accurate stock records, counting little-and-often with cycle counts rather than one panicked year-end stocktake, and focusing that effort on your high-value lines through ABC analysis. Shrinkage is the loss; a stock discrepancy is the count mismatch that reveals it — related, but not the same thing.
Most articles on this topic are written for large retailers and treat shrinkage as mostly shoplifting. For a manufacturer, wholesaler or stockholding business, that framing is misleading: the biggest leak is usually not someone walking out with product, it is your records quietly drifting from reality until the number you plan and sell against is fiction. This guide treats shrinkage as an operations problem — measurable, mostly preventable, and cheaper to fix than to tolerate.
Table of contents
- What inventory shrinkage actually is
- Shrinkage is the loss; a discrepancy is the mismatch
- The shrinkage rate formula, worked in £
- What actually causes shrinkage
- How to measure shrinkage honestly
- How to cut shrinkage: accurate records
- How to cut shrinkage: count little and often
- How to cut shrinkage: focus on the lines that carry the value
- Why shrinkage grows in a spreadsheet
- How an owned system keeps shrinkage visible and small
What inventory shrinkage actually is
Inventory shrinkage is the loss of stock between the point you recorded owning it and the point you go to sell, ship or use it. Your system says 500 units, you count the shelf, and there are 470. Those 30 units are shrinkage: you bought them, they sit on your books as an asset, but they are not there to sell — so their entire cost is a loss, and until you count you do not even know it has happened.
The word names a specific gap: recorded stock minus actual stock. It is what is left unexplained when the physical count comes in lower than the record and no legitimate transaction accounts for the difference.
Two things make shrinkage dangerous out of proportion to its size. First, it is money already spent — every shrunk unit was paid for at cost, so the loss is a direct hit to cash, not a margin dent. Second, and worse, it corrupts every decision downstream: you promise stock you cannot ship, delay a reorder because the number looks healthy, and forecast against a figure that is wrong. A business planning off inflated stock records is planning off fiction, and shrinkage is how the fiction creeps in.
Shrinkage is the loss; a discrepancy is the mismatch
These two terms get used interchangeably, and the confusion causes real muddle, so it is worth pinning down the difference before going further.
A stock discrepancy is the event where a count does not match the record — you expected 500, you found 470. It is a symptom, a moment of measurement, and it can go either way: sometimes you find more than the record says, which is still a discrepancy but not a loss.
Shrinkage is the net loss those discrepancies add up to over time — the cumulative value of stock that has gone missing and cannot be sold. Every instance of shrinkage shows up first as a discrepancy, but not every discrepancy is shrinkage (an overage is a discrepancy that reduces your net shrinkage).
So discrepancies are how you detect shrinkage, and shrinkage is the cost of what they reveal. You only see the loss by counting and finding mismatches, which is why the two are joined at the hip — the counting routine that surfaces mismatches is the routine that quantifies your loss. The mechanics of finding, investigating and preventing the mismatches themselves are covered in how to prevent stock discrepancies; this guide is about the loss those mismatches measure, and what it costs you.
The shrinkage rate formula, worked in £
A raw shrinkage number in units is hard to act on. So shrinkage is expressed as a rate: the value of stock lost as a percentage of the value that passed through.
Shrinkage rate = (cost value of recorded stock − cost value of actual counted stock) ÷ cost value of sales over the period × 100
Some businesses use cost of goods sold as the denominator, some use average stock value held — both are defensible as long as you are consistent period to period. Value everything at cost, not retail, because shrinkage is a loss of what you paid, not of what you hoped to sell for.
Work it through. A wholesaler runs a full count and compares to the system:
- Recorded stock (cost value): £480,000
- Actual counted stock (cost value): £468,500
- Missing stock (cost value): £11,500
- Cost of goods sold over the year: £2,300,000
Shrinkage rate = £11,500 ÷ £2,300,000 × 100 = 0.5%.
Half a percent sounds trivial until you read it back as cash: £11,500 of stock, paid for, gone, unsellable, in one year. That is not a rounding error — it is a salary, or the margin on a large order. And 0.5% is a clean result; a business running on drifting records it has never actually measured could easily be losing several times that. Run the same formula at 1% or 2% on that turnover and you are looking at £23,000–£46,000 a year vanishing without a line item — which is exactly why the number is worth measuring rather than guessing.
Compute the rate per category or ABC band, not just for the whole business, because a blended number hides where the loss actually lives:
| Category | Recorded (cost) | Counted (cost) | Missing (cost) | Category shrinkage rate |
|---|---|---|---|---|
| A-lines (high value) | £300,000 | £291,000 | £9,000 | 3.0% |
| B-lines (mid) | £130,000 | £128,500 | £1,500 | 1.2% |
| C-lines (low value) | £50,000 | £49,000 | £1,000 | 2.0% |
The blended rate across those three is modest, but the A-lines are haemorrhaging at 3% — and because they carry the most value per unit, that is where almost all the cash loss sits. A single company-wide percentage buries that signal. The average tells you whether you have a problem; the breakdown tells you where.
What actually causes shrinkage
The five real sources, roughly in the order they bite a stockholding business:
1. Administrative and booking error. The quiet giant. Goods received but never booked in, or booked in twice. Sales shipped but not decremented, or decremented against the wrong SKU. Transfers logged on one side only. Unit-of-measure slips — receiving a case of 12 as a single unit. None of this is theft; it is paperwork drift, and in most SME operations it is the single largest contributor to the gap. It also produces overages as often as losses, which is why the count sometimes comes in high.
2. Theft. Real, but usually smaller than retailers’ framing suggests for a wholesale or manufacturing operation. Internal theft is the harder and more common form in a stockroom, and it hides best where records are already loose — if your paperwork error is high, every genuine loss looks like just another booking slip, so theft shelters inside it undetected.
3. Damage and spoilage. Stock broken, expired or degraded to unsellable. This is only shrinkage if it is not written off properly — damage you record and remove is a controlled loss. It becomes shrinkage when the broken unit is quietly binned and the record never updated, so the system still counts it as sellable.
4. Supplier short-shipment. You were invoiced for 500, the supplier sent 480, nobody counted the delivery against the order, and you booked in 500. Twenty units of shrinkage created at the receiving door, before the stock touched a shelf. Pure receiving discipline — prevented at goods-in or not at all.
5. Miscounts. The count itself is wrong — a bay counted in a hurry, a transposed figure, a double-counted pallet. A miscount can manufacture phantom shrinkage or hide real shrinkage, which is why counting method matters as much as frequency: a sloppy count does not just fail to find shrinkage, it invents it.
Because admin error and short-shipment usually dominate, the highest-leverage fixes are not security cameras — they are accurate booking-in, disciplined goods receiving, and counts frequent enough to catch drift while it is still small and traceable.
How to measure shrinkage honestly
You cannot cut what you refuse to measure, and the most common failure is not measuring at all — treating the year-end write-off as an unavoidable cost rather than a number to interrogate. Measuring honestly means a few disciplines:
- Value at cost, consistently. Pick your denominator (COGS or average stock value) and keep it fixed so period-to-period comparison means something.
- Count against a frozen record. Snapshot the system figure at the moment of the count. A discrepancy is only real if record and count refer to the same instant.
- Separate the causes you can. Log why a discrepancy occurred where you can trace it. Uncategorised shrinkage is a mystery; categorised shrinkage is a to-do list, and the share you attribute to admin error is the share you can engineer out.
- Measure per band, not just in total. As the worked example showed, the blended rate hides where the loss lives. Track A-lines separately.
- Do not net overages against losses too eagerly. One SKU 20 up and another 20 down nets to zero but is two separate errors; calling it “balanced” hides both.
The honest test: can you state your shrinkage rate for the last period, by category, in cost £? If the only figure you have is a lump written off once a year with no breakdown, you are tolerating the loss, not managing it.
How to cut shrinkage: accurate records
Every method below rests on one foundation: the stock record has to be a truthful, timely reflection of what moved. Most shrinkage does not start as missing product — it starts as a transaction never recorded, recorded twice, or recorded wrong. Fix the record and a large slice of shrinkage never occurs, because it was never a physical loss, just a paper one.
The record stays accurate when every stock movement is captured at the moment it happens:
- Receiving is counted and matched. Goods in are counted against the purchase order before being booked, so a supplier short-shipment is caught at the door and never enters the record — killing that cause outright. The discipline is laid out in the goods receiving process guide.
- Every issue decrements stock. Sales, transfers, production consumption and samples all reduce the record when they happen, not in a batch at week-end when three have been forgotten.
- Damage and write-offs are recorded, not binned quietly. A broken unit removed with a reason code is a controlled loss; the same unit binned silently is shrinkage waiting to be discovered.
- Adjustments require a reason. A pile of unexplained adjustments is shrinkage with the evidence deleted.
Shrinkage prevention and record accuracy are the same project viewed from two angles. The mechanics of keeping count and record aligned — the investigation loop, the root-causing of each mismatch — are the substance of how to prevent stock discrepancies, the operational engine that keeps shrinkage small.
How to cut shrinkage: count little and often
The instinct is to count everything once a year, take the pain, and write off whatever is missing. It is the worst option available, for three reasons:
- It finds the loss too late to trace it. Twelve months of drift in one hit is untraceable. You cannot tell whether that missing £11,500 went in January or last week, by theft or by booking error — so you can only mourn the number, not fix the cause.
- It is disruptive enough that it is done badly. Shutting the operation to count everything at once, usually with tired staff under time pressure, is exactly the condition that produces miscounts — inventing phantom shrinkage and hiding real shrinkage in the same pass.
- It leaves the record wrong for 364 days. Between stocktakes the record drifts unchecked, so you spend most of the year planning against numbers whose accuracy you have no idea about.
The alternative is cycle counting: counting a small subset of stock on a rolling schedule so everything gets counted over a cycle, but nothing shuts down and errors surface while they are still fresh. A discrepancy found on Tuesday can be tied to a receipt or shipment from that same week — so you find and fix the cause, not just adjust the number. It turns shrinkage from an annual autopsy into a continuous early-warning system, and it is the highest-leverage single change most stockholding businesses can make to their shrinkage. The full method is the inventory cycle count guide.
Accurate records and frequent counts compound — records without counts drift unchecked; counts without record discipline just document a mess you keep re-creating.
How to cut shrinkage: focus on the lines that carry the value
You do not have the labour to count every SKU with equal frequency. Shrinkage is a value problem, not a unit-count problem — losing one high-cost line hurts more than losing a hundred cheap ones. So concentrate counting and control where the value is, using ABC analysis.
ABC analysis ranks SKUs by the value they represent — typically annual usage value — into bands: A-lines are the few that carry most of the value, C-lines the many that carry little, B-lines between. The payoff is direct: count A-lines often, B-lines periodically, C-lines rarely. An A-line might be cycle-counted weekly; a C-line once or twice a year is fine, because even a large percentage loss on a low-value line is small money.
This is why the worked example broke shrinkage down by band. The A-lines were leaking at 3% and holding almost all the cash loss — so they earn frequent counting, tight receiving checks and a quick response to any discrepancy, while equal effort on C-lines would be protecting stock barely worth protecting. The full ranking method is in ABC analysis for inventory, the targeting layer that makes cycle counting affordable: it tells you what to count often and what to leave alone.
Why shrinkage grows in a spreadsheet
If your stock lives in a spreadsheet, shrinkage is not a risk but a certainty that grows quietly, because a spreadsheet has no way to keep the record honest between the moments a human updates it. The failure is structural, not a matter of discipline:
- Movements are recorded late or not at all. A sale ships and the sheet is updated this evening — if someone remembers. Every forgotten decrement is shrinkage created in the record before any physical loss has even happened.
- Nothing checks the receipt against the order. A spreadsheet cannot flag that you booked in 500 against a delivery of 480, so the short-shipment enters as phantom inventory until a count finds it months later, untraceable.
- There is no reason code, no audit trail. When the count disagrees with the sheet, you overwrite the cell — and the evidence of why, the whole basis for fixing the cause, is gone.
- Counting is all-or-nothing. A spreadsheet does not schedule cycle counts, so counting collapses back to the annual stocktake and shrinkage reverts to an untraceable write-off.
A spreadsheet can compute a shrinkage rate after the fact. What it cannot do is prevent shrinkage, because prevention requires the record to be captured accurately at the moment each movement happens, and a spreadsheet only knows what someone last had time to type into it.
How an owned system keeps shrinkage visible and small
The arithmetic does not change when you move off the spreadsheet — the rate is the same formula. What changes is that the record stops drifting on its own, because the movements that would have gone unrecorded are captured as they happen.
In a right-sized operations system — built around how your business actually receives, moves and ships stock, sitting in that gap where you are outgrowing spreadsheets and disconnected tools — the shrinkage-fighting disciplines stop depending on someone remembering:
- Receiving is matched to the order at the door, so a supplier short-shipment is flagged before it is booked.
- Every sale, transfer and issue decrements stock as it happens, so the record does not accumulate the forgotten movements that become phantom shrinkage.
- Adjustments carry a reason code and an audit trail, so shrinkage is categorised as it is found — a traceable to-do list, not an annual mystery.
- Cycle counts are scheduled and prompted, with A-lines surfaced off a live ABC ranking, so counting effort lands where the value is.
- The shrinkage rate is computed live, per band, so you see the loss building in the A-lines this month rather than in next year’s write-off.
Spreadsheets are fine at the formula. But shrinkage is prevented by timely, accurate recording plus disciplined counting, and both are things a static file cannot enforce and an owned system can. The same three moves — accurate records, frequent counts, ABC focus — stop being disciplines you have to remember and become how the system works by default. The fully automated inventory system piece walks through what that looks like end to end.
The short version
Inventory shrinkage is the gap between recorded and actual stock — inventory you paid for but cannot sell. Measure it as a rate: missing stock value ÷ sales value at cost, per band as well as in total. The biggest causes for a stockholding business are usually admin/booking error and supplier short-shipment, not theft — good news, because those are the causes you can engineer out. Cut it with three moves that compound: keep the record accurate by capturing every movement as it happens, count little-and-often with cycle counts so discrepancies surface while they are still traceable, and use ABC analysis to point that effort at the high-value lines. And keep the distinction straight: shrinkage is the loss, a discrepancy is the count mismatch that reveals it. The formula is easy — keeping the record honest enough to trust it is the actual job, and that is the one thing a spreadsheet cannot do for you.