
Slow-Moving Inventory: Spotting the Drift Before It Dies
Slow moving inventory is stock that still sells, just far too slowly — the early-warning stage before it goes dead. Here's how to measure it with stock turnover, days-on-hand and ageing buckets, build a SLOB report, and set per-category thresholds so the drift shows up while there's still time to act.
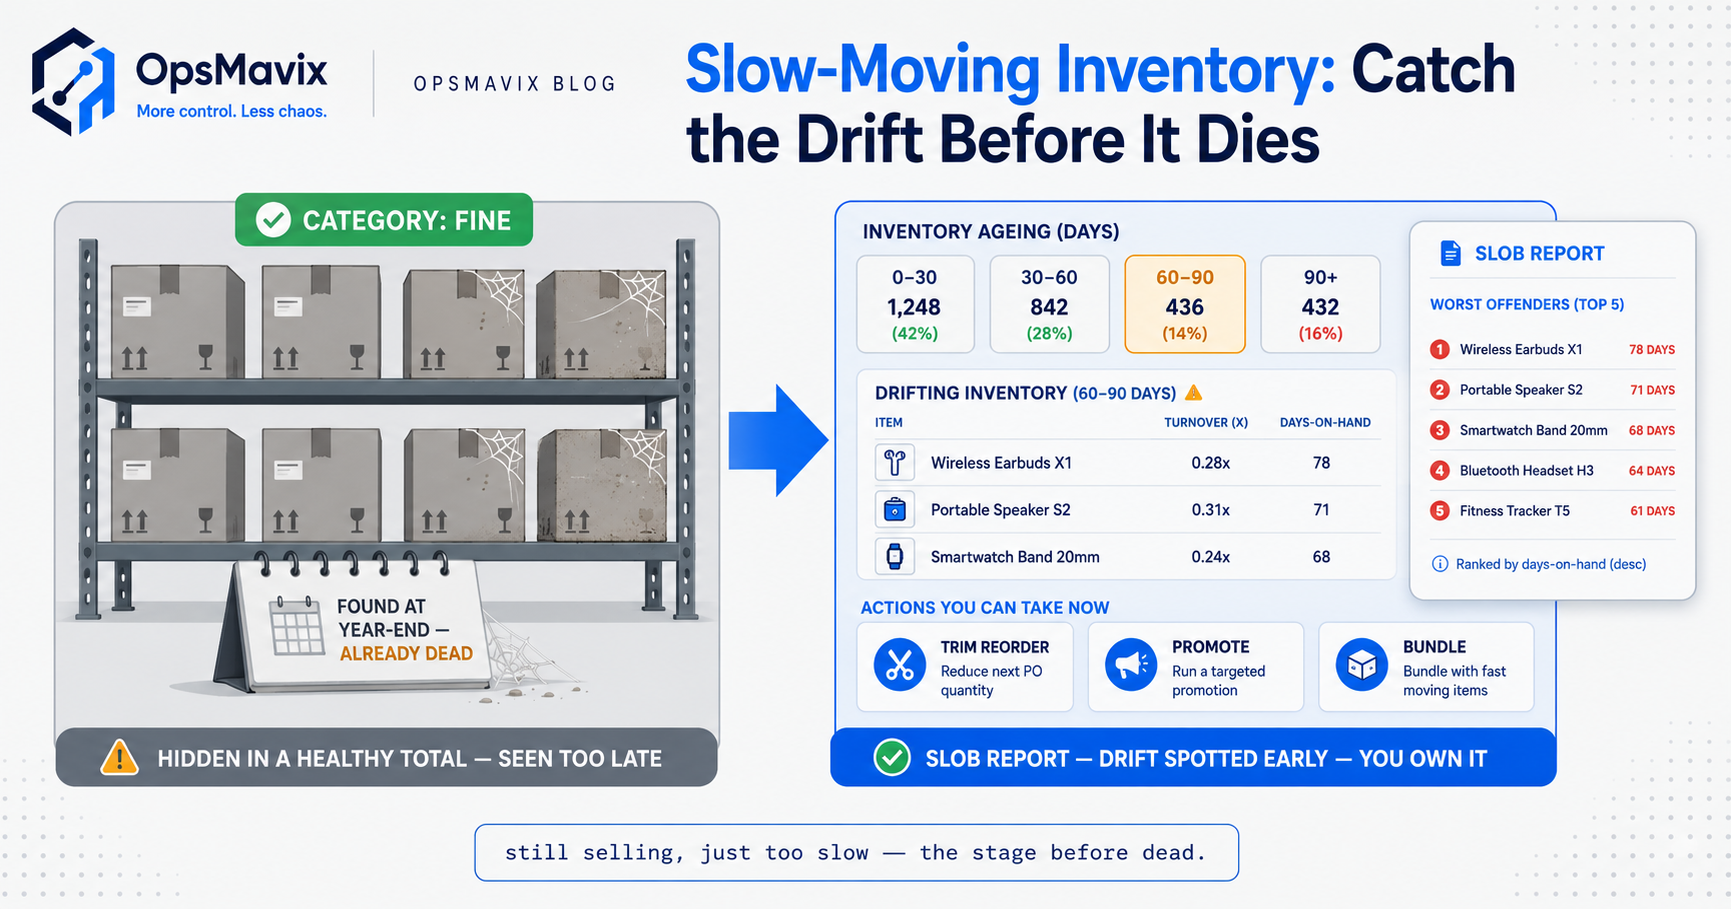
Slow-moving inventory is stock that still sells — just far too slowly to justify how much of it you’re holding. It’s the middle stage: past the healthy fast mover, not yet the dead line you write off at year-end. Catch a SKU here and you have options — trim the reorder, promote it, bundle it. Miss it, and it quietly ages into a loss.
The problem is that slow movers hide. They sit inside a healthy-looking total, still ticking over the odd sale, so nothing flags them. Most businesses only find out when the stock has already stopped moving entirely — because the numbers that would have shown the drift live in separate places, and nobody has the hours to join a stock export to a sales export by hand every month. By the time it’s obvious, the cheap options are gone.
Key Takeaways
- Slow-moving inventory is the early-warning stage — stock still selling, but slowly enough that it’s drifting toward dead. Catch it here and you have choices; catch it later and you have a write-off.
- Stock turnover and days-on-hand are the two headline numbers that separate a fast line from a slow one — how many times a year it sells through, and how long your current holding will last.
- Ageing buckets (0–30, 30–60, 60–90, 90+ days since last movement) turn “too much stock” into a specific, sortable list of the exact lines drifting.
- Sell-through rate shows whether a line is keeping pace with what you bought — the clearest signal that a SKU is stalling.
- A SLOB report (slow-moving and obsolete) is the one recurring document that surfaces the drift; per-category thresholds stop it drowning you in false alarms.
- What to do with confirmed dead stock — clearance, write-off, liquidation — is a separate discipline; this post is about seeing the problem early enough that you rarely get there.
1. Slow-Moving vs Dead: The Stage That Still Has Options
Slow-moving stock and dead stock are not the same problem, and the difference is entirely about timing. A slow mover still sells. It’s just selling below the rate that justifies the quantity on your shelf — twenty a month has become five, then two. Dead stock has effectively stopped. The gap between them is your window to act cheaply, and it’s usually months wide if you’re watching.
That window is the whole point of measuring slow movers separately. When a line is merely slow, a small nudge fixes it: stop the next reorder, feature it, drop it into a bundle with a fast seller. All reversible, all low-cost. Once it’s dead, your only moves cost you margin — and that’s the territory of dead stock management, which is a different job. Here, the goal is narrower and cheaper: see the drift while it’s still just drift.
2. Stock Turnover: How Many Times a Year It Sells Through
Stock turnover — or turn ratio — is the first number to know. In plain terms: how many times over a year do you sell through and replace a line’s average holding. Cost of goods sold for that line, divided by its average stock value. A turn of 8 means it cycles roughly every six weeks. A turn of 1 means you’re holding a year’s worth. A turn below 1 means you’ve got more than a year on the shelf and it’s barely moving.
There’s no universal “good” turn — it depends entirely on what you sell. Fast consumables might turn 20-plus; heavy or specialist kit might healthily turn 2 or 3. What matters is turnover relative to that line’s own history and its category. A SKU that turned 6 last year and turns 2 this year is telling you something, regardless of the absolute number. The drop is the signal, not the level.
3. Days-on-Hand: How Long Your Current Pile Lasts
If turnover is the yearly rhythm, days-on-hand (or days-of-inventory) is the same idea pointed at right now: at the current rate of sale, how many days will the stock you’re holding last. Fifteen days-on-hand is tight and healthy for a mover. Three hundred days-on-hand on a line selling a handful a month means you’re sitting on the better part of a year’s supply — a slow mover by definition, whatever the sales ticker says.
Days-on-hand is the number operators feel fastest because it maps straight onto the shelf. One inventory manager we spoke to described the moment it clicked: “we weren’t short of anything, we were drowning — half the racking was stuff we had two years of and hadn’t noticed.” That’s days-on-hand doing its job. It reframes “we have plenty” as “we have far too long a supply of the wrong lines,” which is exactly what a slow mover is.
4. Ageing Buckets: Turning a Total into a List
Turnover and days-on-hand tell you a line is slow. Ageing buckets tell you which lines, sorted so you can act. Group every SKU by how long since it last moved — 0–30 days, 30–60, 60–90, 90-plus — and the healthy total you’ve been staring at splits into a picture. The stuff in 0–30 is alive. The stuff piling up in 60–90 and beyond is your drift, laid out line by line.
The buckets matter because an average lies to you. A category can look fine on aggregate — decent overall turn, sales still coming in — while a third of its SKUs haven’t moved in three months, propped up by a handful of stars. Ageing pulls those laggards out of the average and names them. A distributor we spoke to put it bluntly: “the P&L said the category was fine, so nobody looked — the ageing report was the first time anyone saw that forty lines hadn’t sold since spring.” That’s the difference between a number and a list you can act on.
5. Sell-Through Rate: Is It Keeping Pace With What You Bought
Sell-through rate ties the whole thing to reality: of what you brought in over a period, how much has actually sold. Received 100 units, sold 30 in the quarter — that’s 30% sell-through, and if the pattern holds you’ve got a slow mover on your hands. It’s the cleanest early signal because it catches a line stalling relative to the bet you made on it, not against some abstract benchmark.
Sell-through is especially sharp on new lines and seasonal buys, where turnover history doesn’t exist yet. You can’t compute a meaningful annual turn on a product you launched six weeks ago — but you can see that it’s sold 8% of the intake and the season’s a third gone. Read together, sell-through, days-on-hand and turnover give you three angles on the same question: is this line pulling its weight, or is it quietly becoming the thing you’ll be marking down in a year. Pair it with a reorder point system and the slow signal feeds straight into whether you top the line up at all.
6. Building a SLOB Report and Setting Thresholds
Put those metrics together and you get a SLOB report — slow-moving and obsolete — the one recurring document that surfaces the drift. At its core it’s every SKU, with its turn, its days-on-hand, its ageing bucket and its sell-through, sorted so the worst offenders float to the top. Run monthly and reviewed by someone with authority to act, it turns slow-moving stock from a year-end surprise into a standing agenda item.
The trap is thresholds. A single rule — “flag anything over 90 days” — buries you in false alarms, because a specialist spare that turns twice a year isn’t slow, it’s just slow by nature. Thresholds have to be per-category. Fast consumables might flag at 45 days-on-hand; long-tail spares might only flag past 200. Set them against each category’s normal rhythm and the report stops crying wolf. Get this right and the SLOB report becomes the thing people actually read, because when it flags a line, the flag means something. Keeping the underlying counts honest matters too — a good inventory cycle count is what stops the SLOB report ageing phantom stock that isn’t really there.
7. Where This Breaks Down, and Where a System Earns Its Place
Plenty of businesses can start this on a spreadsheet, and honestly should. If you’ve got a manageable catalogue and your inventory tool exports stock and sales cleanly, a monthly SLOB tab is a fine place to begin — the discipline matters more than the software. A slow-mover list reviewed religiously beats a dashboard nobody opens.
The spreadsheet breaks at scale and at joins. Once you’ve got thousands of SKUs across categories and channels, computing turn and days-on-hand and sell-through by hand every month is work nobody sustains, so the report quietly stops being run. And the joins are the real killer: stock lives in one system, sales history in another, purchasing in a third, and no off-the-shelf tool stitches them into your ageing bands with your per-category thresholds. Our POV at OpsMavix is that slow-moving inventory is a reporting problem before it’s a stock problem — the drift is almost always already in your data; you just can’t see it because nothing joins the numbers up. Build that join once, into an inventory automation system shaped around how your business actually reads stock, and the SLOB report runs itself.
Slow Movers: Seen Early vs Found Late
| Found late (spreadsheet + gut) | Seen early (SLOB report + thresholds) | |
|---|---|---|
| First sight of a slow mover | Year-end, already dead | Live, at 60–90 days and drifting |
| The signal | “We have too much stock” | Turn, days-on-hand, sell-through, per SKU |
| The list | Hidden in a healthy total | Ageing buckets, worst offenders on top |
| Thresholds | One rule, endless false alarms | Per-category, tuned to normal rhythm |
| Options left | Markdown or write-off | Trim reorder, promote, bundle |
| Cash & space tied up | Unknown until the accountant flags it | A live figure you watch and cut |
FAQ
What is slow-moving inventory?
Slow-moving inventory is stock that still sells but at a rate too low to justify how much you’re holding — the early-warning stage before a line goes dead. It’s measured with stock turnover, days-on-hand and sell-through rate, and surfaced through ageing buckets. The reason to track it separately from dead stock is timing: while a line is merely slow you still have cheap, reversible options, whereas dead stock usually costs you margin to shift.
How do I calculate stock turnover?
Divide the cost of goods sold for a line over a period by its average stock value for that period. A turn of 8 means the line sells through and is replaced roughly every six weeks; a turn below 1 means you’re holding more than a year’s supply. There’s no universal “good” turn — it depends on what you sell — so read each line against its own history and its category rather than a single benchmark. A falling turn is the signal, not the absolute number.
What are inventory ageing buckets?
Ageing buckets group every SKU by how long since it last moved — commonly 0–30, 30–60, 60–90 and 90-plus days. They matter because an average stock figure hides slow movers inside healthy lines; bucketing pulls each drifting SKU out of the total and puts a date on it, turning a vague “we have too much” into a specific, sortable list you can act on line by line.
What is a SLOB report?
A SLOB report — slow-moving and obsolete — is a recurring document listing every SKU with its turnover, days-on-hand, ageing bucket and sell-through, sorted so the worst offenders surface first. Run monthly and reviewed by someone able to act, it turns slow-moving stock from a year-end shock into a standing decision. The key to a useful one is per-category thresholds, so it flags genuine drift rather than lines that are simply slow by nature.
What should I do once a line is confirmed dead?
That’s a separate discipline. Once stock has genuinely stopped selling, you’re into clearance tiers, markdowns, liquidation and write-offs — covered in full in our guide to dead stock management. The purpose of tracking slow-moving inventory is to reach that point as rarely as possible: catch the drift early, and most lines never make it to the write-off column.
How OpsMavix Can Help
OpsMavix builds custom inventory automation systems for stock-holding businesses caught in the gap — too many SKUs to age and report by hand, not enough scale to justify a full ERP that buries ageing in a sub-menu. For slow-moving stock specifically, that means turnover, days-on-hand and sell-through computed automatically per line, ageing buckets in your own bands, a SLOB report that runs on schedule, and per-category thresholds so the flags mean something. Built around how your business actually reads stock, and yours to own outright — no black box, no vendor able to switch it off.
If you suspect there’s cash and warehouse space tied up in lines that stopped pulling their weight but can’t put a number on it, that’s a leak you’re paying for every day. Book a Free Operations Leak Audit.
Keep reading

Getting value from OpsMavix? Add us as a preferred source on Google — you'll see more of our operations content in your AI Overviews, AI Mode and Search.