
How to Calculate Reorder Point (Formula + Worked Example)
How to calculate reorder point comes down to one formula — (average daily usage × lead time in days) + safety stock. Here's the maths, a worked example with the numbers shown, where safety stock comes from, and the honest catch nobody tells you: a reorder point calculated once and parked in a spreadsheet quietly rots as demand and lead times drift.
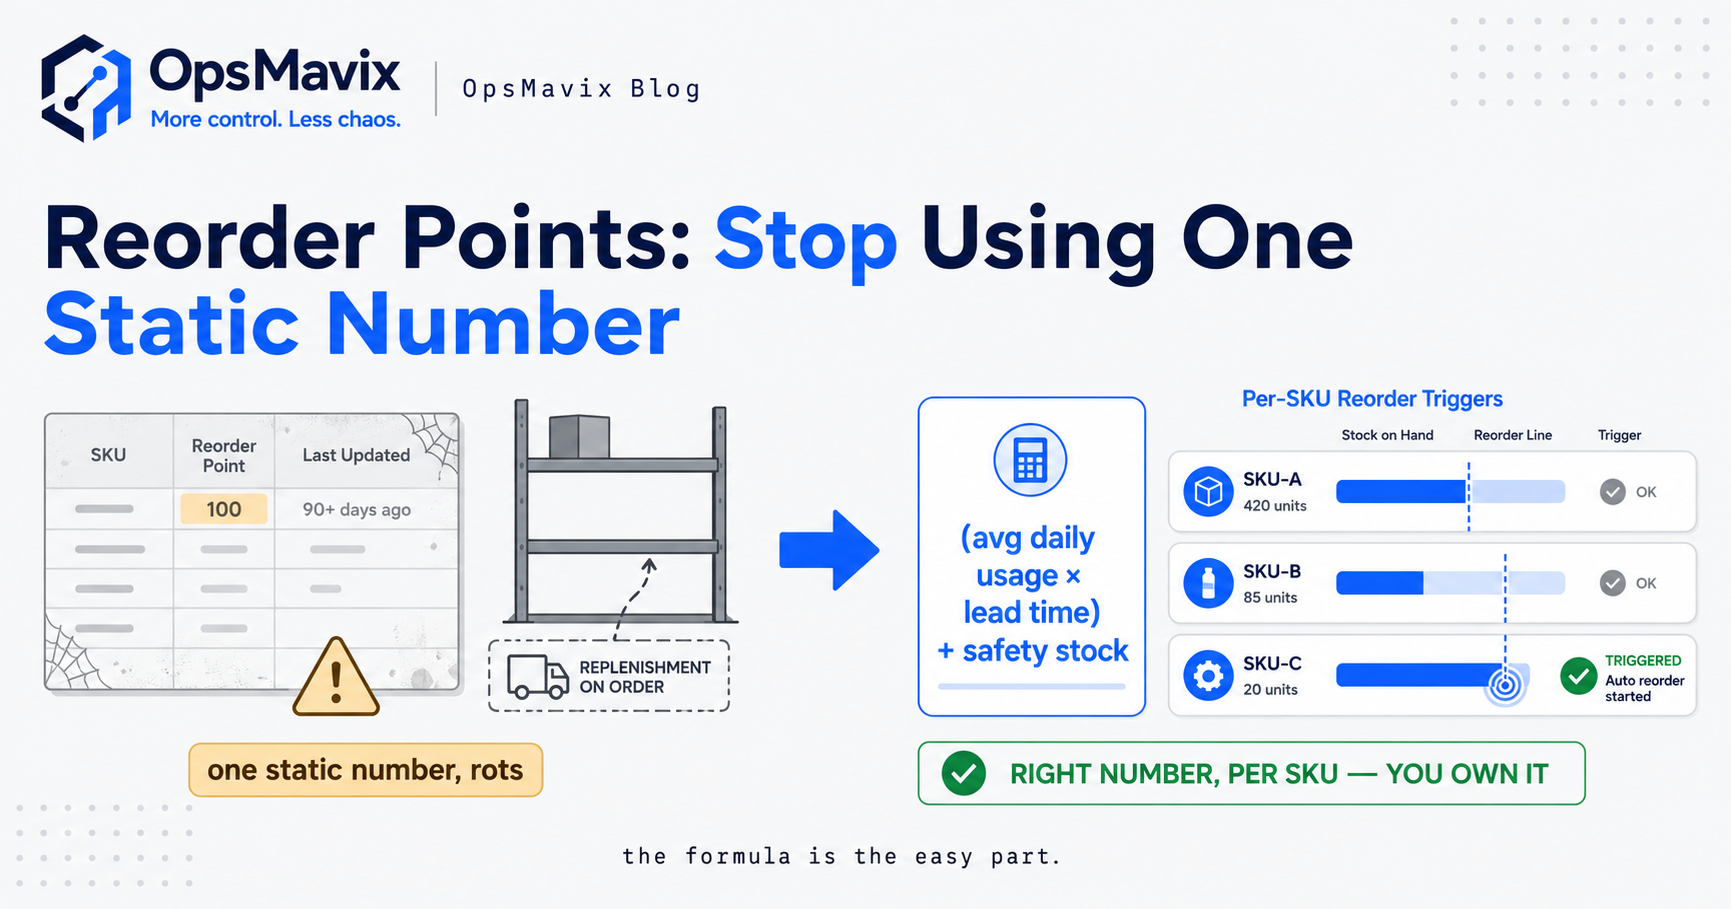
How to calculate reorder point comes down to one line of maths: reorder point = (average daily usage × lead time in days) + safety stock. Work out how much of a line you sell in an average day, multiply it by how many days the supplier really takes to get stock back on your shelf, then add a buffer for the days that don’t run to average — and you have the stock level at which you place the next order. Sit above that level, do nothing. Drop through it, and it’s time to buy: what you have left just covers demand while the new stock is in transit.
The maths is genuinely simple, and that’s the trap. Most guides stop at the formula and move on. The part that actually decides whether reorder points work isn’t the calculation — it’s keeping the number current, per line, as demand climbs into a season and suppliers quietly slip. A reorder point is only right on the day you set it, and this post covers both halves: the formula with a worked example, and the honest reason a single static figure per SKU stops being enough.
Key Takeaways
- The formula is one line: reorder point = (average daily usage × lead time in days) + safety stock. Everything else is getting the three inputs honest.
- Lead time is the full clock from placing the order to the stock being sellable on the shelf — supplier processing, transit, goods-in, put-away — not just the courier’s leg.
- Safety stock is the buffer for the surprises, sized per line off how much demand and lead time vary — not one blanket figure across the catalogue.
- One reorder point per SKU, not one blanket number — a fast seller from a slow supplier needs a completely different trigger than a steady line from a reliable one.
- A static number rots. Calculate it once, park it in a spreadsheet, and it’s quietly wrong the moment demand or lead time drifts — with nothing to tell you.
- For slow, steady demand a spreadsheet reorder point genuinely works — the maths breaks down when demand swings, lead times move, or you’ve got too many lines to re-tune by hand.
The Formula, and What Each Part Means
Here it is once more, because the rest of the post hangs off it:
Reorder point = (average daily usage × lead time in days) + safety stock.
The first half — average daily usage × lead time — is your lead-time demand: what you’ll sell while you wait for the supplier to deliver. Shift 20 units a day on a 7-day lead time and you’ll burn 140 units during the wait, so you have to order while you still have at least 140 on hand or you run dry before the delivery lands. The second half, safety stock, is the cushion for the days that don’t run to average; leave it out and your reorder point assumes every week is average and every supplier is punctual — the assumption that empties shelves. Behind the formula sit three inputs worth getting right one at a time.
Input One: Average Daily Usage
Average daily usage is how many units of a line you sell, or consume, in a typical day. Pull it from real sales history rather than a gut figure — total the units sold over a recent, representative stretch and divide by the number of days.
The word doing the heavy lifting is representative: a 30-day window that straddles a promotion or a dead spell hands you an average that’s wrong in both directions. A month is fine for a steady line; for a seasonal one, an annual average hides the peaks you need to survive, so you’d size the trigger for the quiet middle and stock out every peak. This is why demand forecasting and reorder points are two halves of the same job — the better your read on a line’s swing, the more honest your daily-usage figure.
Input Two: Lead Time (the Number Everyone Gets Wrong)
Lead time quietly breaks most reorder points. People measure it as “how long the courier takes” — the transit leg — and set the trigger too low. Real lead time is the full clock from the moment you decide to order to the moment the stock is sellable on the shelf: supplier processing, production or picking at their end, transit, your goods-in, checking and put-away. Every one of those steps is time your shelf is draining, so every one belongs in the number.
Include the times a supplier is genuinely late — those are the occasions the reorder point exists to cover. A “5-day” supplier who slips to 12 twice a quarter isn’t a 5-day supplier for planning. If you only have a gut feel, time a few real orders end to end; the true figure is usually longer than the one in your head. Understate lead time and the trigger fires too late every time — the shelf is empty before the delivery you triggered even arrives.
Input Three: Safety Stock (Where It Comes From)
Safety stock is the buffer bolted onto lead-time demand to absorb the surprises — a busier-than-average week and a slower-than-average delivery landing at once. Skip it and every good week or late delivery becomes a stockout; overdo it with a blanket “keep two weeks of everything” and you’ve quietly overstocked the whole catalogue, freezing cash against a surprise that rarely comes.
A practical way to size it, without a statistics degree, is the max-minus-average method.
Safety stock = (max daily usage × max lead time) − (average daily usage × average lead time).
That covers the realistic bad case — your busiest days landing on your supplier’s slowest delivery — rather than a number plucked from nerves. Steady lines from a reliable supplier need barely any cushion; lines that spike hard, or come from a supplier who’s late half the time, need a real one. Safety stock is a topic in its own right — the service-level and z-score approach, seasonal re-tuning — and the full treatment lives in the safety stock calculation guide. For the reorder point, treat it as one input sized to how much that line actually surprises you.
Worked Example (Illustrative Numbers)
Illustrative numbers — a worked example, not real data — but the method is exactly what you’d apply to your own lines. Take a single SKU. Over the last 30 days it sold 600 units, so average daily usage = 20 units. Its supplier’s honest lead time — order placed to shelf-ready — averages 7 days. On a busy week the line has hit 32 units a day, and the supplier has slipped to 11 days at his worst.
First, lead-time demand: 20 units × 7 days = 140 units — what you’ll sell during a normal wait. Next, safety stock by the max-minus-average method: (32 × 11) − (20 × 7) = 352 − 140 = 212 units — the extra you’d need if your busiest days landed on the supplier’s slowest delivery.
Add them: reorder point = 140 + 212 = 352 units. When this line drops to 352 on hand, you order. Note how much of the trigger is buffer — 212 of the 352 — because this line both spikes and comes from an unreliable supplier. A steady line from a punctual supplier flips that: if usage barely strayed from 20 and the supplier never slipped past 8 days, the safety-stock term shrinks to a few dozen units and the trigger sits closer to 160. Same formula, wildly different number.
One Reorder Point Per SKU, Not One Blanket Number
The worked example is the case against a single blanket reorder level — two lines at the same average daily rate needed 352 and 160. Apply one number to both and you either overstock the steady line or under-protect the volatile one and stock out on the products that hurt most to lose. So it’s a per-line job: a catalogue of a few hundred lines is a few hundred reorder points, each with three inputs that move independently. Which is why so many businesses set a blanket figure and hope — doing the per-line maths by hand across the whole range, repeatedly, is the part that never happens.
Why a Static Number Rots (and When a Spreadsheet Is Still Fine)
Here’s the honest catch. Do the calculation properly, drop the results into a spreadsheet, and on the day you set it, it’s right. Then reality moves and the spreadsheet doesn’t. Demand climbs into a season and the old average daily usage is too low, so the trigger fires late and you stock out on your best lines at the worst time. A supplier’s lead time creeps from 7 days to 12 over a quiet year, and every reorder point built on the old figure is now too small — while a line that’s tailing off keeps pulling in stock you’ll never sell, the seed of a cycle stock pile. A static reorder point is a snapshot of one day’s assumptions, and all three inputs drift while the spreadsheet can neither notice nor re-tune itself. The calculation was never the hard part; keeping it current, per line, forever, is.
That said, the spreadsheet isn’t always wrong. If a line has slow, steady demand — much the same handful every week — from a supplier whose lead time barely moves, a reorder point you calculate once and check occasionally genuinely works: nothing is drifting, so it stays roughly right, and you shouldn’t buy software you don’t need. The maths stops being enough at three points: when demand swings (seasonality, promotions, erratic B2B orders), when lead times move so last quarter’s figure is silently wrong this one, and — most commonly — when you have too many lines to re-tune by hand. At that point the number rots between checks, and the trigger has to read live stock and re-calculate itself or it’s wrong.
Automating the Trigger So It Fires Itself
Once the per-line maintenance outgrows a person, the fix is a system that does the noticing for you. Instead of someone scanning levels and reacting, it watches every line’s live quantity against its reorder point and raises the alert the moment one drops through, or drafts the purchase order ready to send. The calculation runs continuously and re-tunes as the numbers move, so the trigger is honest in peak season, not just on the day you set it.
Built around your setup, that alert knows more than “you’re low” — it knows the right supplier, their real lead time, the quantity to order, and any minimum-order or price-break to hit while you’re buying, the sort of thing a right-sized inventory automation system is built to handle and the commercial side the reorder point system guide covers in full. The formula is the easy 20%; making it fire itself, per line, forever, is the 80% that keeps the shelf off zero.
FAQ
How do you calculate reorder point?
Reorder point = (average daily usage × lead time in days) + safety stock. Work out how many units the line sells in an average day from real sales history, multiply by the honest lead time — the full clock from placing the order to the stock being sellable on the shelf — and add a safety-stock buffer for spikes and late deliveries. The result is the level at which you place the next order, so it arrives before you run dry.
What is the reorder point formula with a worked example?
Take a line selling 600 units over 30 days, so average daily usage is 20. On a 7-day lead time, lead-time demand is 20 × 7 = 140. If busy days hit 32 units and the supplier can slip to 11 days, safety stock by the max-minus-average method is (32 × 11) − (20 × 7) = 212. Reorder point = 140 + 212 = 352 units — when the line drops to 352 on hand, you order. (Illustrative numbers — the method is what transfers to your lines.)
What lead time should I use in the calculation?
The full clock from placing the order to the stock being sellable on the shelf — supplier processing, production or picking, transit, goods-in, checking and put-away — not just the courier’s transit leg. Include the times a supplier is genuinely late, since those are the occasions the reorder point exists to cover. Understating lead time is the most common reason a trigger fires too late and the shelf empties before the delivery lands.
Do I need software, or is a spreadsheet enough?
For a short, steady catalogue — slow, predictable lines from suppliers whose lead times barely move — a spreadsheet reorder point you check occasionally is genuinely fine, and you shouldn’t buy software you don’t need. It stops being enough when demand swings, when lead times drift, or when you have too many lines to re-tune by hand — at which point the number rots between checks, and a system that reads live stock and re-calculates itself keeps the trigger honest.
How OpsMavix Can Help
The formula on this page is the easy part — you can run it in a spreadsheet this afternoon. What OpsMavix builds is the part that keeps it true after the spreadsheet would have gone stale: custom inventory systems, for businesses stuck between spreadsheets and a full ERP, that hold a live reorder point per SKU. Average daily usage from your real sales, each supplier’s honest lead time, safety stock sized to how much each line varies, re-tuned as seasons and suppliers drift — firing the alert or draft PO before you run out, grouped by supplier, owned outright with nothing a vendor can switch off.
If you’re stocking out on your sellers one month and staring at stock that won’t shift the next, that swing is a reorder calculation nobody’s had time to maintain — leaking money from both ends. Book a Free Operations Leak Audit.
Keep reading
Getting value from OpsMavix? Add us as a preferred source on Google — you'll see more of our operations content in your AI Overviews, AI Mode and Search.