
Safety Stock Calculation: How to Size the Buffer Per Line
A safety stock calculation sizes the buffer each line needs to survive a demand spike or a late delivery — without a blanket "two weeks of everything" quietly overstocking you. Here are the formulas in plain terms, the service-level trade-off, and how to size per line.
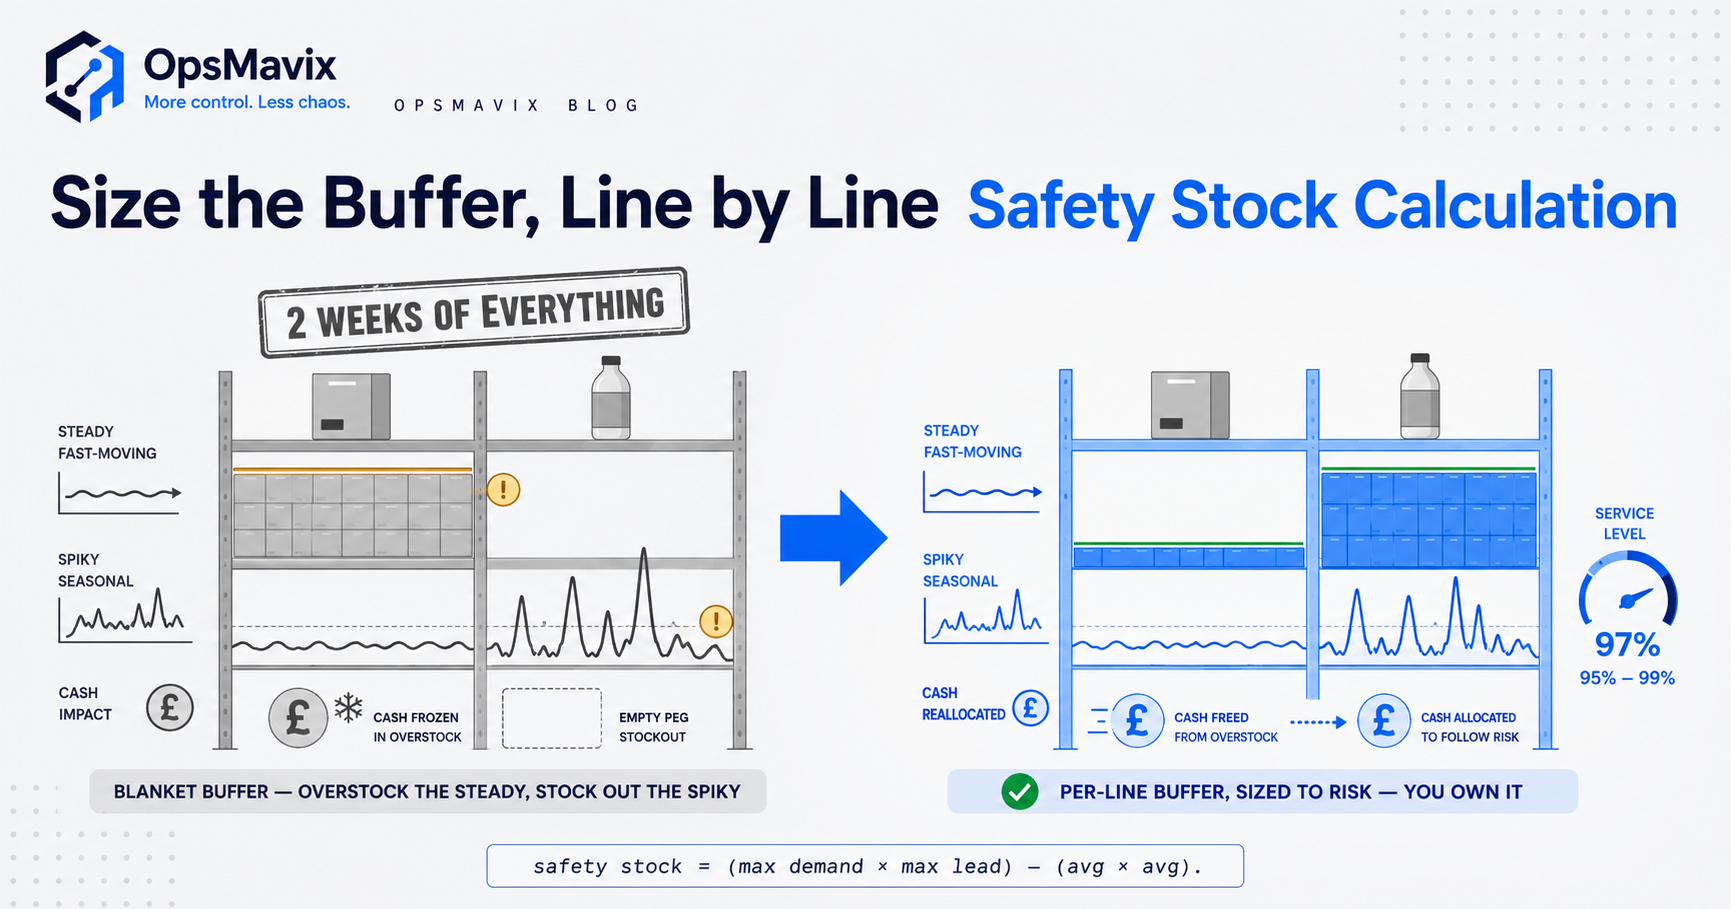
A safety stock calculation works out how much extra of a line you hold on top of normal demand, so a busy week or a late delivery doesn’t leave you with an empty shelf. It’s the buffer between “we usually sell about this much” and the days you don’t run to average. Get the amount right per line and you absorb the surprises without tying up cash in stock you don’t need.
Most growing businesses set this by feel — a round number, or a blanket “keep a couple of weeks of everything” copied across the whole catalogue. It holds up until a supplier slips, a line spikes, or someone notices half the warehouse is buffer nobody sized on purpose. The buffer that should protect your sellers ends up drowning your slow movers in cash, and the maths that would fix it lives in a spreadsheet nobody re-runs.
Key Takeaways
- A safety stock calculation sizes the buffer each line needs to survive demand spikes and late deliveries — not a number picked from nerves.
- The basic formula is real and simple: (max daily demand × max lead time) − (average daily demand × average lead time).
- The service-level approach uses a z-score to set how often you’re willing to stock out — 95% cover costs less to hold than 99%.
- Demand and lead-time variability decide the buffer, so it’s sized per line, not one figure smeared across everything.
- A blanket “two weeks of everything” quietly overstocks steady lines and under-protects volatile ones at the same time.
- Buffers need re-tuning for seasons — a summer figure held through winter is either too much cash or a stockout waiting to happen.
1. What a Safety Stock Calculation Actually Works Out
Safety stock is the cushion you hold beyond what you expect to sell during a supplier’s lead time. Expected demand you can plan for; safety stock covers the part you can’t — the week that runs hot, the delivery that turns up three days late. The calculation turns that vague “keep a bit spare” into a specific number for each line.
It’s a separate question from when to reorder. The reorder trigger fires when stock drops to a set level; the safety stock is the slice of that level held back for the bad case, so you don’t hit zero while you wait. If you want the full trigger logic — the point at which the order fires and how much to bring in — that’s the reorder point system, and this buffer is one input into it. Here we’re only sizing the buffer itself.
The reason the number matters is that both directions cost money. Too small and every late delivery becomes a lost sale and a customer checking a competitor. Too large and you’ve turned working capital into shelves of insurance you rarely draw on. The calculation is how you land between the two on purpose rather than by accident.
2. The Basic Formula, in Plain Terms
The workhorse calculation is the max-minus-average method:
Safety stock = (max daily demand × max lead time) − (average daily demand × average lead time).
The first half is the realistic worst case: your busiest days landing on your supplier’s slowest delivery. The second half is the normal case you already plan for. The gap between them is the buffer — exactly the extra you’d need if the bad case turned up instead of the average one. If you usually sell 20 a day on a 7-day lead time but a peak week hits 35 a day and the supplier can drag to 12 days, the maths says hold enough to cover the difference, not a round guess.
The number people get wrong is lead time. It isn’t “how long the courier takes” — it’s the full clock from placing the order to the stock being sellable on the shelf: supplier processing, transit, goods-in, put-away. Use the honest max there, including the time a supplier is genuinely late, and the buffer protects you against the failure that actually happens.
3. The Service-Level Method and the Z-Score, Simply
The max-minus-average method is blunt: it plans for the single worst case, which can over-buffer lines that rarely hit their extreme. The service-level method is more precise. Instead of “cover the worst day ever,” it asks a business question — what percentage of the time am I willing to have this line in stock? A 95% service level means you accept stocking out about one order cycle in twenty; 99% means roughly one in a hundred.
The z-score is just the dial that turns that percentage into a multiplier. Higher target, higher z-score, bigger buffer. Under this method the buffer is the z-score multiplied by how much demand actually wobbles over the lead time — so a line whose sales swing wildly gets a fat buffer, and a steady line gets a thin one, at the same service level. You don’t need to hand-calculate z-scores; you need to understand the trade the dial represents. Chasing that last few percent of service is where holding cost climbs fastest, because the buffer needed to go from 95% to 99% is far larger than the one that got you to 95% in the first place.
4. Sizing Per Line: Variability Decides It
The whole point of doing the maths is that lines don’t behave the same, so their buffers shouldn’t either. Two things drive a line’s buffer: how much its demand jumps around, and how unreliable its supplier is. A line that sells a steady handful every day from a supplier who’s never late barely needs a cushion. A line that spikes hard around promotions, or comes from a supplier who’s late half the time, needs a real one.
A wholesale distributor described the problem cleanly: their fast, predictable lines were the ones sitting deepest in buffer, because those were the ones the old blanket rule padded most, while the erratic seasonal lines — the ones that actually stocked out — ran the same thin cover as everything else. The buffer was pointing at the wrong stock entirely. Sizing per line flips that: cash follows the risk, so the volatile sellers get protected and the steady lines stop hoarding cash they never draw on.
This is also where demand data earns its place. The better your read on how a line really sells — its swing, its seasonality, its trend — the tighter you can size its buffer, which is why demand forecasting and safety stock are two halves of the same job rather than separate exercises.
5. Why “Two Weeks of Everything” Quietly Overstocks
The blanket rule is popular because it’s easy: pick a cover period, apply it everywhere, done. The problem is it’s wrong in two directions at once. On your steady, fast-moving lines, two weeks of buffer is far more than the risk warrants — that’s cash and shelf space frozen for a surprise that rarely comes. On your volatile lines, the same two weeks may not cover a real spike, so you still stock out on exactly the products that hurt most to lose.
Here’s the £ framing. Say a blanket buffer parks an average of £40,000 across the catalogue. Size it per line and the steady majority need far less, while a handful of volatile sellers need a bit more; the total often lands well below the blanket figure and stocks out less, because the cash moved from lines that never needed it to lines that did. Same protection, less money on the shelf — that’s the swing a real calculation buys you. One inventory manager we spoke to put it plainly: their blanket buffer felt safe right up until they added up what it was costing to feel safe.
Left too long, that frozen buffer curdles into stock that never moves at all — which is how a lazy safety-stock policy becomes a dead stock problem you’re writing off a year later.
6. Re-Tuning for Seasonality and Drift
A buffer sized in a quiet month is wrong in a busy one. Demand climbs into a season and the summer figure held through the winter peak is too thin — you stock out at the worst possible time. The reverse is just as expensive: carry a peak-sized buffer through the off-season and you’ve parked cash for months against demand that isn’t coming. A safety stock number is only right for the conditions you sized it in.
Lead times drift too, and quietly. A supplier that used to turn orders in 5 days creeps to 12 over a year of nobody watching, and every buffer built on the old figure is now too small. Prices move, minimums change, a line’s demand pattern shifts. None of it announces itself. The buffer that was correct when you set it slowly stops being correct, and the only signal you get is a stockout or a stocktake full of stuff that isn’t selling.
7. Why a Spreadsheet Buffer Rots — and What Replaces It
Plenty of businesses do run the calculation once, in a spreadsheet, on a good day. The trouble is the spreadsheet can’t re-tune itself. It doesn’t watch demand climb into a season, doesn’t notice a supplier’s lead time slipping, doesn’t re-score which lines have turned volatile. It’s a snapshot of one day’s assumptions, and the moment any of them move it’s quietly wrong — with no way to tell you.
Our contrarian take: safety stock isn’t a number you set, it’s a number you maintain — and maintenance by hand across hundreds of lines never actually happens on a busy week. A right-sized inventory automation system re-reads real demand and real lead times per line, sizes each buffer to that line’s actual variability and your chosen service level, and re-tunes as the seasons and suppliers move. Built around your setup and owned outright, it turns safety stock from a spreadsheet somebody forgot into a live figure that stays honest — feeding straight into the reorder trigger so the buffer and the “when to buy” decision finally agree.
FAQ
What is a safety stock calculation?
A safety stock calculation works out how much extra of a line to hold beyond expected lead-time demand, to cover the surprises — a busier-than-average week or a slower-than-average delivery. It’s sized per line off how much that line’s demand and supplier lead time actually vary. The goal is to absorb the bad case without over-buffering the steady lines, so cash sits where the risk is.
How do you calculate safety stock?
The basic method is (max daily demand × max lead time) − (average daily demand × average lead time), which covers your busiest days landing on your supplier’s slowest delivery. The more precise method uses a service level and z-score to set the buffer from how much demand wobbles over the lead time, so you decide how often you’re willing to stock out. Either way, measure lead time as the full clock from order to sellable shelf, not just courier transit.
What service level should I aim for?
It depends on the line. High-margin sellers and lines customers won’t wait for justify a higher service level — 98–99% — because a stockout there is expensive. Slow or easily-substituted lines can run leaner, maybe 90–95%, since the cost of an occasional gap is small. Chasing the last few percent is where holding cost climbs fastest, so reserve the highest levels for the lines that actually earn it rather than applying one target everywhere.
Why is a blanket buffer a problem?
Because it’s wrong in both directions at once. A flat “two weeks of everything” over-buffers steady, predictable lines — freezing cash against a surprise that rarely comes — while under-protecting volatile lines that need more, so you still stock out on the products that hurt most. Sizing per line moves the cash from where it’s wasted to where it’s needed, usually cutting total buffer and stockouts at the same time.
How does safety stock relate to reorder points?
Safety stock is one ingredient in the reorder point, not a separate system. The reorder point is lead-time demand plus safety stock — the buffer is the slice held back for the bad case so you don’t hit zero while waiting. This post sizes the buffer; the full trigger logic, including when the order fires and how much to bring in, lives in the reorder point system.
How OpsMavix Can Help
OpsMavix builds custom inventory systems for businesses stuck between spreadsheets and a full ERP — including the safety-stock logic that decides how much buffer each line actually needs. Per-line buffers sized off your real demand and your suppliers’ real lead times, set to a service level you choose line by line, and re-tuned as seasons and lead times drift — so cash follows the risk instead of sitting evenly across a catalogue that doesn’t need it.
If you’re stocking out on your sellers one month and staring at frozen buffer the next, that swing is money leaking from both ends, and a blanket rule is usually the cause. Book a Free Operations Leak Audit.
Keep reading
Getting value from OpsMavix? Add us as a preferred source on Google — you'll see more of our operations content in your AI Overviews, AI Mode and Search.