
Cycle Stock: The Working Inventory Between Replenishments (and How to Calculate It)
Cycle stock is the portion of your inventory you cycle through and sell down between one replenishment and the next — the working stock, not the buffer. This post gives you the cycle stock calculation plainly (average cycle inventory = order quantity ÷ 2), separates it from safety stock, and shows why it's the cash you choose to tie up via order size. It also explains why a spreadsheet quietly stops re-deriving it as demand and order quantities drift, and how a system computes average cycle inventory per line.
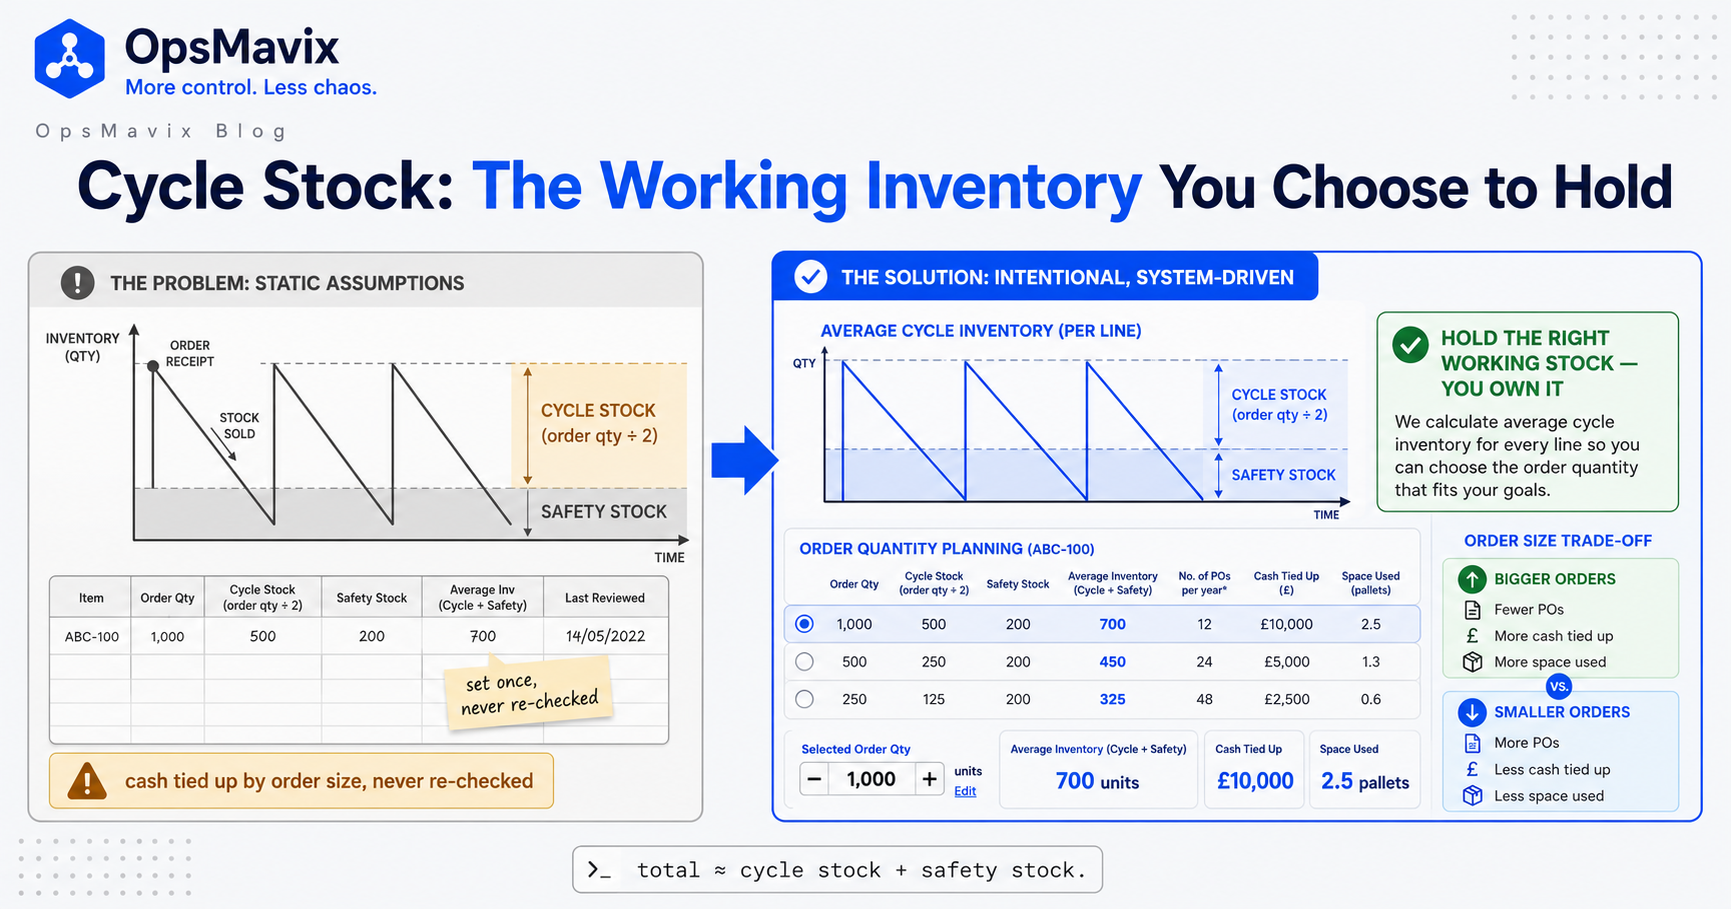
Cycle stock is the portion of your inventory that you cycle through — sell, use or ship — between one replenishment and the next. It’s the working stock: the units you deliberately hold because you order in batches rather than buying each item the instant a customer asks for it. Order 600 units of a line every month, sell them down to zero, reorder, and the amount sitting on the shelf across that month averages out to roughly half the order — that average is your cycle stock. It’s the most ordinary inventory you own, and the least understood, because most businesses never separate it from the buffer sitting underneath it.
This post is about cycle stock specifically: what it is, how to calculate it, and why it matters that it’s a number you choose rather than one forced on you. Safety stock — the buffer you hold against demand and supply variability — has its own safety stock calculation, and the reorder point is the trigger that says order now. Neither of those is what we’re covering here. Cycle stock is the working quantity between replenishments, and it’s the part of your stockholding you have the most direct control over — which is exactly why it’s worth knowing how to size it.
Key Takeaways
- Cycle stock is the working inventory you cycle through between replenishments — the stock you hold because you order in batches, not because you’re buffering against uncertainty.
- The cycle stock calculation is simple: average cycle inventory = order quantity ÷ 2, because a batch is sold down from full to empty over each cycle, averaging half.
- Total inventory ≈ cycle stock + safety stock. Cycle stock is the sawtooth that rises at each delivery and falls as you sell; safety stock is the flat cushion underneath it.
- Cycle stock is the cash you choose to tie up. Bigger order quantities mean more cycle stock but fewer orders and less ordering effort; smaller, more frequent orders free cash but cost more in handling — that’s the batch-size trade-off.
- Safety stock is forced on you by variability; cycle stock is a decision. You can’t wish variability away, but you can resize an order quantity tomorrow — which makes cycle stock the faster lever on tied-up cash.
- A spreadsheet never re-derives cycle stock as demand and order quantities drift, so the number quietly goes stale; a system recomputes average cycle inventory per line from live order sizes.
What Cycle Stock Actually Is
Picture the stock level of one product over time. A delivery lands and the level jumps to its peak. You sell through it day by day and the line slopes down. It reaches the bottom, the next delivery lands, and the level jumps back up. That repeating rise-and-fall — the classic sawtooth — is cycle stock in motion. It exists purely because you replenish in batches. If you could buy exactly one unit at the precise moment each customer wanted it, at no cost and no delay, cycle stock would be zero. You don’t, because ordering has cost and lead time, so you buy in lots and hold the surplus until it sells.
That’s the whole idea: cycle stock is the inventory that comes from ordering in quantities larger than one. It’s active, moving stock — it turns over every cycle. This is what separates it cleanly from safety stock, which ideally never gets touched at all. Safety stock sits at the bottom of the sawtooth as a flat cushion; cycle stock is the triangle riding on top of it. You plan to consume cycle stock down to (near) zero every cycle. You plan to never consume safety stock — it’s there for the cycle that goes wrong.
The Cycle Stock Calculation (Average Cycle Inventory)
Here’s the formula, and it’s refreshingly plain. Over one replenishment cycle you receive a full order quantity and sell it down to zero, so on average — across the whole cycle — you’re holding half of it:
Average cycle inventory = order quantity ÷ 2
Order 600 units at a time and your average cycle stock for that line is 300 units. Order 1,200 at a time and it’s 600. That’s it. The “÷ 2” comes straight from the sawtooth: full at the top, empty at the bottom, and the average of a straight slide from full to empty is the midpoint. To put a cash figure on it, multiply by unit cost — 300 units at £8 each is £2,400 of average cycle stock tied up in that one line, before you’ve held a single unit of safety stock.
To go from one line to a whole warehouse, you calculate average cycle inventory per line and sum it. That per-line detail matters, because order quantities vary wildly across a catalogue — a fast mover reordered in pallets and a slow line reordered in tens have very different cycle stocks, and a single blended number hides both. This is also why cycle stock and ABC analysis belong in the same conversation: your A-lines usually carry the bulk of the cycle-stock cash, and they’re where re-sizing order quantities frees the most money.
How Cycle Stock and Safety Stock Add Up
The two numbers stack. As a working approximation, your total average inventory for a line is:
Total inventory ≈ cycle stock + safety stock
Cycle stock (order quantity ÷ 2) is the working portion that turns over each cycle; safety stock is the buffer that sits beneath it against variability. Add them and you have roughly what you’re holding on average. Keep them separate and you can see why you’re holding it — how much is a batching decision and how much is an insurance decision. That distinction is the entire point of splitting them, because the two respond to completely different levers and blending them hides which one to pull.
It’s worth being precise about the boundary so this post doesn’t tread on the others. The buffer — how deep the cushion should be for a given service level and demand variability — is the safety stock calculation, and it deserves its own working. The moment you actually place the order — the stock level that triggers replenishment — is the job of a reorder point system, which combines lead-time demand with that safety buffer. Cycle stock owns neither the buffer nor the trigger. It owns the quantity you replenish with, and therefore the average working stock that quantity implies.
Cycle Stock Is the Cash You Choose to Tie Up
This is the part most stock conversations miss. Safety stock is largely forced on you — it’s a function of how variable your demand and supply are, and you can’t negotiate with variability. Cycle stock is different: it’s the direct result of a decision you make, the order quantity, and you can change that decision at the next purchase order. Double the order size and you halve the number of orders but double the average cycle stock — and the cash locked in it. Halve the order size and you free that cash but place twice as many orders, with twice the handling, admin and inbound cost. Nothing about the underlying demand changed. You simply chose to tie up more or less working capital.
That trade-off is what economic order quantity (EOQ) tries to balance: order too small and ordering costs pile up; order too large and holding costs — the cash, the space, the risk of the line going stale — pile up instead. You don’t need to run textbook EOQ to act on this. The insight alone is enough: cycle stock is a dial, and it’s usually the fastest dial you have on tied-up cash, because you can turn it on the next PO without touching your service level. It’s a different problem from slow-moving inventory, where the issue is stock that barely turns at all — but oversized order quantities are one quiet way a healthy line starts looking slow, because you bought a year of it in one go.
The Batch-Size Trade-off in Practice
Bigger batches aren’t automatically wasteful and smaller batches aren’t automatically lean — the right order quantity depends on the real costs on each side. Supplier price breaks, minimum order quantities, inbound freight that’s cheaper per unit on a full pallet, and the admin time of raising and receiving each order all push toward larger batches. Cash constraints, limited shelf and rack space, shelf-life or obsolescence risk, and the flexibility to respond to changing demand all push toward smaller, more frequent ones. Cycle stock is simply the visible consequence of where you land between those forces.
The trap is treating the order quantity as a fact of nature rather than a choice — the number someone typed into the system three years ago, or the “we always order a pallet” habit no one has revisited since volumes changed. When demand on a line has halved but the order quantity hasn’t, you’re now holding twice as many cycles of cover as you meant to, and the excess cash is invisible because nobody re-ran the maths. Good demand forecasting feeds this directly: if you have a credible view of near-term demand, you can right-size order quantities against it instead of against a habit, and your cycle stock stops drifting away from what the business actually needs.
Why a Spreadsheet Quietly Stops Re-deriving It
The cycle stock calculation is easy enough that a spreadsheet can do it — once. The problem is that it never re-does it. Average cycle inventory depends on your order quantity, and order quantity should track demand: as a line speeds up or slows down, the sensible batch size moves with it. On a spreadsheet, that re-derivation is a manual job nobody schedules. You set an order quantity, type the resulting cycle stock into a cell, and it sits there frozen while the real demand underneath it drifts month after month. The number on the sheet stops describing the business the moment either figure changes, and nothing tells you.
This is the same failure mode that quietly breaks a reorder point on a spreadsheet — a formula that was right the day it was typed and slowly rots because the inputs move and the cell doesn’t. Cycle stock rots the same way, only more invisibly, because a stale reorder point eventually causes a stockout you notice, whereas a stale cycle-stock figure just means you’re carrying the wrong amount of working capital and no alarm ever goes off. It shows up as a cash-flow squeeze or a warehouse that’s fuller than it should be, and by then it’s spread across hundreds of lines that each drifted a little.
How a System Computes Average Cycle Inventory per Line
A right-sized operations system treats average cycle inventory as a live figure, not a typed-in constant. It knows the current order quantity for each line — from the actual purchase orders, not a stale cell — and it re-derives cycle stock (order quantity ÷ 2, costed at current unit price) automatically whenever that quantity changes. Do it per line, sum it up, and you get a running total of the working capital your batching decisions are tying up, sliced by product, supplier, or ABC class, without anyone rebuilding a spreadsheet at month-end.
That live view is what turns cycle stock from a textbook definition into a usable lever. You can see which lines carry the most cycle-stock cash, test what smaller order quantities would free, and spot lines where the order quantity hasn’t moved even though demand has — the exact places where cash is quietly stuck. Because the system also holds your safety stock and reorder logic in the same place, it can present the honest full picture: here’s your working stock, here’s your buffer, here’s the total, and here’s which half is a decision you can change versus a variability you have to cover. That separation is impossible to hold in your head across a catalogue and painful to maintain by hand, which is precisely why it usually isn’t maintained.
FAQ
What is cycle stock?
Cycle stock is the working portion of inventory you cycle through — sell, use or ship — between one replenishment and the next. It exists because you order in batches rather than buying each unit the instant it’s needed, so you hold the surplus of each order until it sells down. On an inventory-over-time chart it’s the sawtooth that jumps up at each delivery and slopes down as you consume it, riding on top of the flat safety-stock cushion. It’s active stock that turns over every cycle, which distinguishes it from safety stock, which is a buffer you plan never to touch.
How do you calculate cycle stock?
The cycle stock calculation is average cycle inventory = order quantity ÷ 2. Over each cycle you receive a full order and sell it down to zero, so on average you hold half the order quantity. Order 600 units at a time and your average cycle stock is 300; multiply by unit cost to get the cash tied up. For a whole catalogue, calculate average cycle inventory per line and sum it, because order quantities vary too much across products for a single blended number to be meaningful.
What’s the difference between cycle stock and safety stock?
Cycle stock is the working inventory you cycle through between replenishments, driven by your order quantity — a decision you control. Safety stock is the buffer you hold against demand and supply variability — largely forced on you by how uncertain those are. Total average inventory is roughly cycle stock plus safety stock. Keeping them separate matters because they respond to different levers: you resize cycle stock by changing order quantities, whereas safety stock changes only if your variability or target service level does.
Why does cycle stock go wrong on a spreadsheet?
Because a spreadsheet computes it once and never re-derives it. Average cycle inventory depends on order quantity, which should track demand — but on a sheet, someone types the number in and it stays frozen while the real demand drifts. The figure stops describing the business the moment either input changes, and nothing flags it. Unlike a stale reorder point, which eventually causes a visible stockout, a stale cycle-stock figure just means you’re carrying the wrong amount of working capital with no alarm — it surfaces as a cash squeeze or an overfull warehouse.
How OpsMavix Can Help
OpsMavix builds right-sized operational systems for businesses that have outgrown the spreadsheet but aren’t ready — and shouldn’t have to pay — for a full ERP. Instead of a workbook that computes cycle stock once and then quietly lies about it, we move stock control into a system that re-derives average cycle inventory per line from your live order quantities, sits it next to your safety stock and reorder logic, and shows you the honest split: here’s the working capital your batching decisions are tying up, here’s the buffer variability forces on you, and here are the lines where an oversized order quantity is stuck holding cash you could free. You own it outright — no per-seat licence, nothing a vendor can switch off — as inventory automation that keeps every number current instead of a spreadsheet that goes stale between reviews.
If order quantities set by habit are tying up more working capital than they should, a Free Operations Leak Audit will map exactly where — line by line, in cash — and show you what right-sizing your cycle stock is worth.
Keep reading



Getting value from OpsMavix? Add us as a preferred source on Google — you'll see more of our operations content in your AI Overviews, AI Mode and Search.