
GMROI Calculation: The Inventory Metric That Ties Stock to Profit
GMROI answers the one question margin and turnover each answer only half of: for every pound sitting in stock, how many pounds of gross margin does it earn you back? This is the formula, a plain-English worked example in pounds, why a low-margin fast-mover can beat a high-margin slow-mover, and how to use GMROI to rank products and cull ranges.
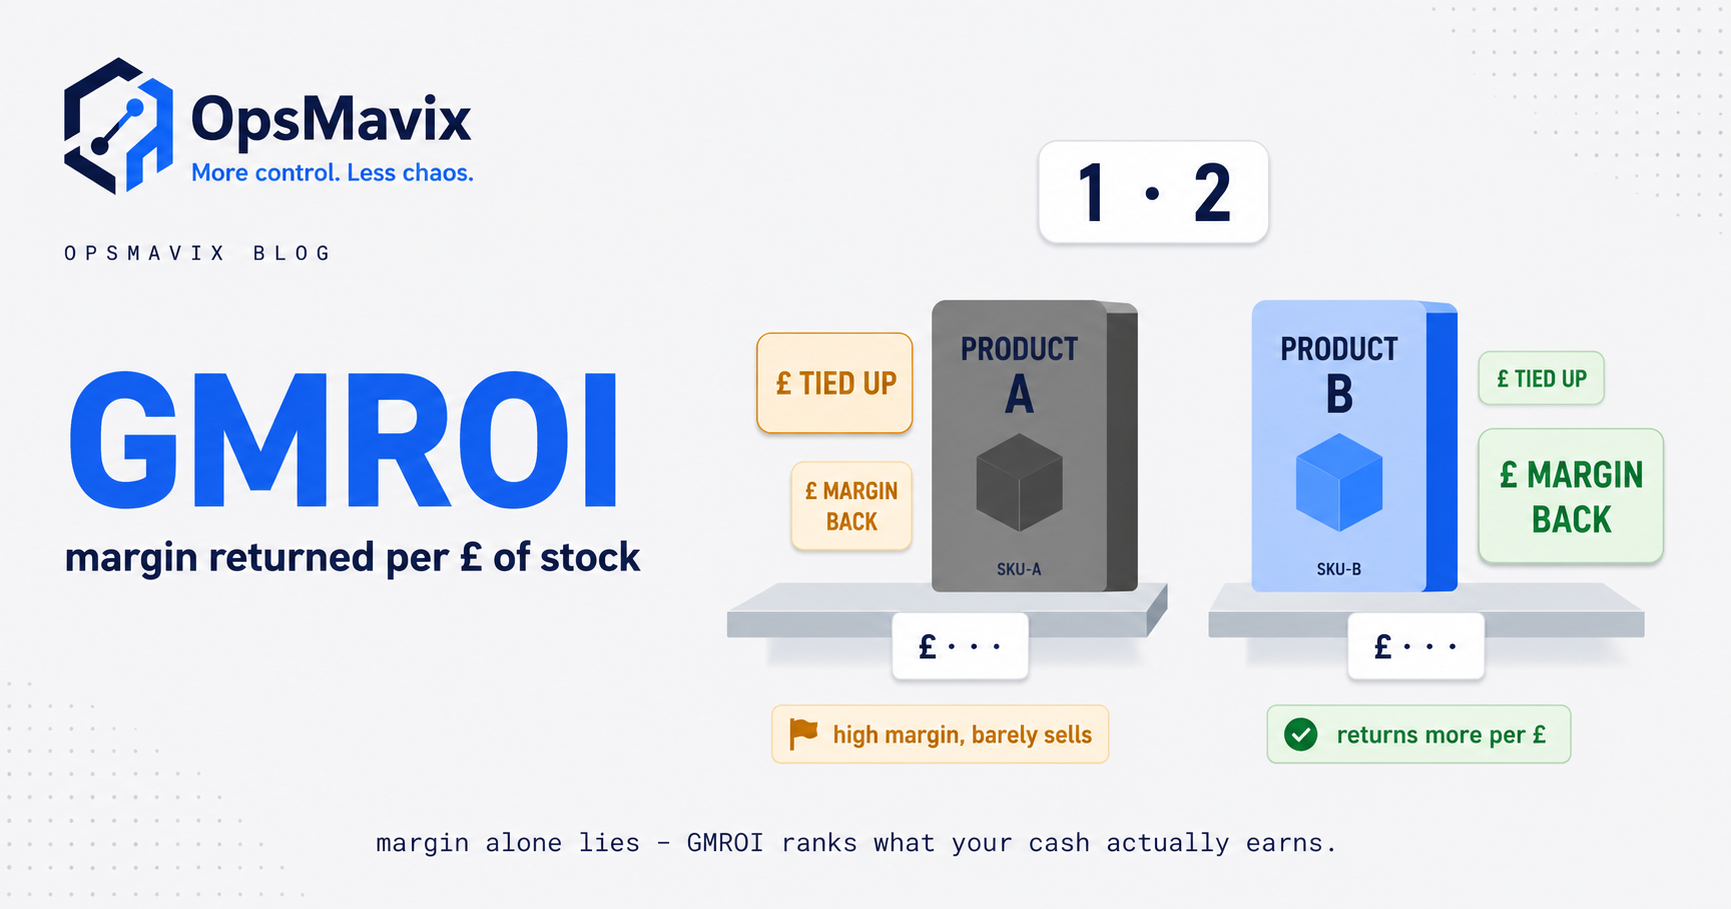
Quick summary: GMROI — gross margin return on inventory investment — measures how many pounds of gross margin you earn for every pound tied up in stock, calculated as annual gross margin (£) ÷ average inventory cost (£). A GMROI of £3.20 means every £1 of stock returned £3.20 of margin over the year. It beats looking at margin percentage or stock turnover in isolation because it combines both: a low-margin product that sells fast can return more cash than a high-margin product that sits on the shelf. Use it to rank SKUs, decide what to reorder, and justify culling dead weight from the range.
Margin tells you how profitable each sale is. Turnover tells you how often the stock sells through. Neither, on its own, tells you whether the money you sank into that stock is working. A product can have a fat margin and still be a bad use of cash if it barely moves; a thin-margin line can quietly be one of your best cash generators because it turns over ten times a year. GMROI is the single number that settles that argument, and it is the number most small operations never calculate because their stock and their margins live in different spreadsheets.
What you’ll find here
What GMROI actually is
GMROI stands for gross margin return on inventory investment. It is a productivity ratio for the cash you have parked in stock. Every unit on your shelf represents money you spent that you cannot spend on anything else until it sells. GMROI asks the blunt question: for each pound of that trapped money, how many pounds of gross margin did it earn you back over the year?
The answer comes out as a money multiple, not a percentage. A GMROI of £2.50 means that across the year, every £1 you had tied up in that stock generated £2.50 of gross margin. Below £1.00 and the line is losing you money in the pure sense — the margin it earns does not even cover the cost of the cash sitting in it, before you have paid for the shelf space, the counting, or the write-offs.
The reason it matters more than either of its ingredients is that stock is almost always the largest controllable asset a stock-holding business owns. You can have a healthy profit-and-loss statement and still be quietly strangled by cash locked in slow-moving inventory. GMROI is the metric that makes that visible at the level where you can do something about it: the individual product.
The GMROI formula
The formula is deliberately simple:
GMROI = Annual gross margin (£) ÷ Average inventory cost (£)
Two inputs. Both are things you either already have or can get.
Annual gross margin (£) is not margin percentage. It is the actual pounds of gross profit the product generated over the year: annual sales revenue minus the cost of the goods that were sold. If you sold 1,200 units at £25 that cost you £15 each, your annual gross margin is 1,200 × (£25 − £15) = £12,000.
Average inventory cost (£) is the average value of the stock you held during the year, valued at what it cost you — not at retail. The cleanest quick version is (opening stock cost + closing stock cost) ÷ 2. For more accuracy, average the month-end stock values across all twelve months. Crucially this is at cost, because GMROI measures the return on the money you actually spent, and you spent the cost price, not the shelf price.
A common variant you will see written as:
GMROI = Gross margin % × Stock turnover (at cost)
This is the same thing rearranged, and it is worth understanding because it shows exactly why GMROI captures both levers at once. Margin percentage is how much you make per sale; turnover at cost is how many times the average stock investment sold through in the year. Multiply them and you get return on the investment. A product wins on GMROI by being high-margin, fast-turning, or a good-enough blend of the two.
A worked example
Take three products on the same shelf. On paper they look very different, and a naive eye would rank them in the wrong order.
| Product | Sell price | Cost | Margin % | Units sold/yr | Avg stock held (units) |
|---|---|---|---|---|---|
| A — premium mixer | £120 | £72 | 40% | 150 | 40 |
| B — house-brand soap | £4 | £2.80 | 30% | 6,000 | 250 |
| C — display gift set | £45 | £27 | 40% | 90 | 45 |
Now run GMROI on each.
Product A — premium mixer. Annual gross margin = 150 × (£120 − £72) = 150 × £48 = £7,200. Average inventory at cost = 40 × £72 = £2,880. GMROI = £7,200 ÷ £2,880 = £2.50.
Product B — house-brand soap. Annual gross margin = 6,000 × (£4 − £2.80) = 6,000 × £1.20 = £7,200. Average inventory at cost = 250 × £2.80 = £700. GMROI = £7,200 ÷ £700 = £10.29.
Product C — display gift set. Annual gross margin = 90 × (£45 − £27) = 90 × £18 = £1,620. Average inventory at cost = 45 × £27 = £1,215. GMROI = £1,620 ÷ £1,215 = £1.33.
Look at what happened. Products A and B threw off exactly the same £7,200 of gross margin for the year. If you ranked them on margin pounds alone, they would tie. If you ranked them on margin percentage, the mixer (40%) would beat the soap (30%) and you would favour the mixer. Both readings are wrong. The soap returned £10.29 for every pound tied up in it; the mixer returned £2.50. The soap is four times the cash machine, because the same margin came off a fraction of the invested stock — it turned over far more times in the year.
Product C looks respectable on margin percentage — a healthy 40%, same as the mixer — but its GMROI of £1.33 is barely above the point where a product stops paying for the money inside it. It is a slow-moving, cash-hungry line dressed up in a good margin percentage. That is precisely the kind of product a margin report protects and a GMROI report exposes.
Why GMROI beats margin or turnover alone
Each of the two familiar metrics tells you half the story, and either half can point you the wrong way.
Margin percentage in isolation flatters slow movers. A 60%-margin product feels like a star. But if you buy it in, hold a lot of it, and it trickles out over eighteen months, that 60% is earned on cash that could have turned over three or four times somewhere else in the same period. High margin on stagnant stock is a slow bleed you have decided to feel good about.
Turnover in isolation flatters thin margins. A product can rip through the shelf twelve times a year and still be a poor use of the business if the margin on each sale is so thin that all that motion generates very little profit. Turnover counts the laps; it does not count what you win per lap.
GMROI multiplies the two together, so it cannot be fooled by a strong reading on one side and a weak reading on the other. It rewards the honest combination: money that both earns a decent margin and comes back to you quickly enough to earn it again. The soap in the example above wins not because it is high-margin (it is the lowest) but because low margin repeated often beats high margin held still.
This is also why GMROI is the right lens for a range with very different product types in it. Comparing a £120 appliance to a £4 consumable on margin percentage is meaningless — of course they differ. Comparing them on how hard their invested cash works is exactly the comparison you want to make when deciding where the next £10,000 of purchasing budget should go.
Using GMROI to rank products and cull ranges
The practical payoff is a ranked list. Calculate GMROI for every SKU, sort descending, and you have an honest league table of how hard each product’s cash is working. Three things fall out of that table.
Reorder confidence at the top. The products with the highest GMROI are the ones where more stock is almost always the right call, because you have proof that money poured into them comes back quickly with margin attached. These deserve tighter availability and generous reorder points; running them out of stock is the most expensive mistake in the range.
Investigation in the middle. Mid-table products are usually fine but worth a periodic look — a small margin improvement or a modest reduction in how much you hold can move them up without any change in sales.
Hard questions at the bottom. Products with a GMROI below about £1.00–£1.50 are candidates for culling. Before you delete them, ask whether the problem is the numerator or the denominator. If gross margin is the problem, can you raise the price or negotiate the cost down? If the invested stock is the problem, you are simply holding too much — cut the order quantity and the same sales will produce a far better GMROI. Often a “bad” product is a good product buried under too much stock, and the fix is buying discipline, not deletion.
The bottom of a GMROI ranking is also where you find the range’s true dead weight — lines that are neither profitable enough nor fast enough to justify the cash and shelf space they occupy. That overlaps directly with dead stock management: a GMROI ranking is one of the cleanest early-warning systems for stock that is on its way to becoming dead, long before it shows up as an explicit write-off.
A ranked GMROI list also pairs naturally with an ABC analysis. ABC classifies stock by how much of your revenue or usage each SKU accounts for; GMROI tells you how efficiently each SKU converts invested cash into margin. A product that is an A-item by revenue but a poor performer on GMROI is a specific, important finding: it is central to your sales but a drag on your cash, and it deserves management attention that neither metric would flag on its own.
What counts as a good GMROI
There is no universal number, because it depends entirely on your sector’s margins and how fast that sector’s stock naturally moves.
- High-turnover, low-margin sectors — grocery, fast-moving consumer goods, convenience — live on high GMROI figures because the whole model is thin margins repeated constantly. A weak line there might still clear £3–£4.
- High-margin, slow-turn sectors — furniture, jewellery, specialist equipment — run on lower GMROI figures because the stock genuinely takes longer to sell, and that is priced into fatter margins.
The floor that holds everywhere is £1.00: below it, the gross margin a product earns does not even repay the cost of the money locked inside it, before any other holding cost. Anything hovering near £1.00 is a problem regardless of sector.
Rather than chase a benchmark you read somewhere, compare each product against the others in its own category and against its own trend over time. A GMROI that is falling quarter on quarter is a signal worth acting on even if the absolute number still looks respectable — it usually means stock is building up faster than sales, or margin is being eroded by discounting or rising costs.
If you run a stock-heavy consumer range, the sector-specific mechanics of keeping GMROI high — small, frequent orders, tight availability on the fast movers, ruthless honesty about the tail — are covered in FMCG stock management, where high turnover is the entire game.
Where GMROI fits alongside turnover and ABC
GMROI is not a replacement for your other inventory metrics; it is the one that ties them together into a profit view. A quick map of how they relate:
| Metric | Question it answers | Blind spot |
|---|---|---|
| Gross margin % | How profitable is each sale? | Ignores how fast, or whether, the stock moves |
| Stock turnover | How often does the stock sell through? | Ignores how much margin each turn earns |
| ABC analysis | Which SKUs matter most to revenue/usage? | Ignores how efficiently cash is used |
| GMROI | How many £ of margin does each £ of stock return? | Needs both margin and cost-based stock data together |
Read together, they form a decision loop. ABC tells you which products are worth the most attention. GMROI tells you which of those products are using cash well and which are quietly wasting it. Turnover and margin tell you which lever to pull when a GMROI figure is disappointing — is it slow, thin, or both? None of the four is sufficient alone, but GMROI is the one that expresses the result in the currency the business actually cares about: pounds of margin per pound invested.
The practical reason most small operations never see this loop is not that the maths is hard — you have watched it above, and it is arithmetic. It is that the two inputs live apart. Margin data sits in the accounts or the point-of-sale export; average stock-at-cost sits in a stock spreadsheet that is out of date the moment it is saved, if it exists at all. Joining them by hand, per SKU, across a few hundred lines, once a quarter, is the kind of job that gets started once and never repeated.
Getting the numbers without a finance team
You do not need a finance team; you need the two inputs to live in the same place and update themselves.
Annual gross margin per SKU falls straight out of sales data if every product carries an accurate cost price. The single most common reason GMROI comes out wrong is a stale or missing cost — a supplier raised their price eight months ago and the cost field still shows the old number, so every margin above it is a fiction. Keeping cost prices current, ideally including landed cost where import duty and freight are material, is the unglamorous foundation the whole metric stands on.
Average inventory at cost is the harder input by hand, because it is a moving figure across the year. This is where a system that records stock movements as they happen earns its place: if the quantity on hand and the cost per unit are both maintained continuously, the average inventory value is a report, not a research project. That is one of the concrete jobs a fully automated inventory system does — it holds the live stock position and the cost against every line, so a GMROI ranking across the whole catalogue is a button, not a fortnight.
Once both inputs are live, GMROI stops being an annual accounting exercise and becomes an operating dashboard: a ranked list you glance at before every big purchase order, a filter that surfaces the tail before it dies, and a plain-English answer to the question that actually matters — is the money in my stock working, or is it just sitting there?
GMROI does not require new software to understand — a spreadsheet and one honest afternoon will rank your range and probably surprise you. What it requires to stay useful is current cost prices and a live stock value, because a metric that ties stock to profit is only as good as the two numbers feeding it. Get those two things trustworthy and GMROI becomes the sharpest single view you have of whether your largest asset is pulling its weight.