
The True Cost of a Stockout (and How to Stop Overselling)
A stockout does not cost you one sale. It costs the margin on that sale, sometimes the customer for good, a dent in your marketplace ranking, a rush-freight bill to recover, and hours of staff firefighting. This guide breaks the full cost down into five parts, gives you a simple £ framework to estimate it for your own business, separates a true stockout from a phantom-stock oversell, and lays out the operational fixes.
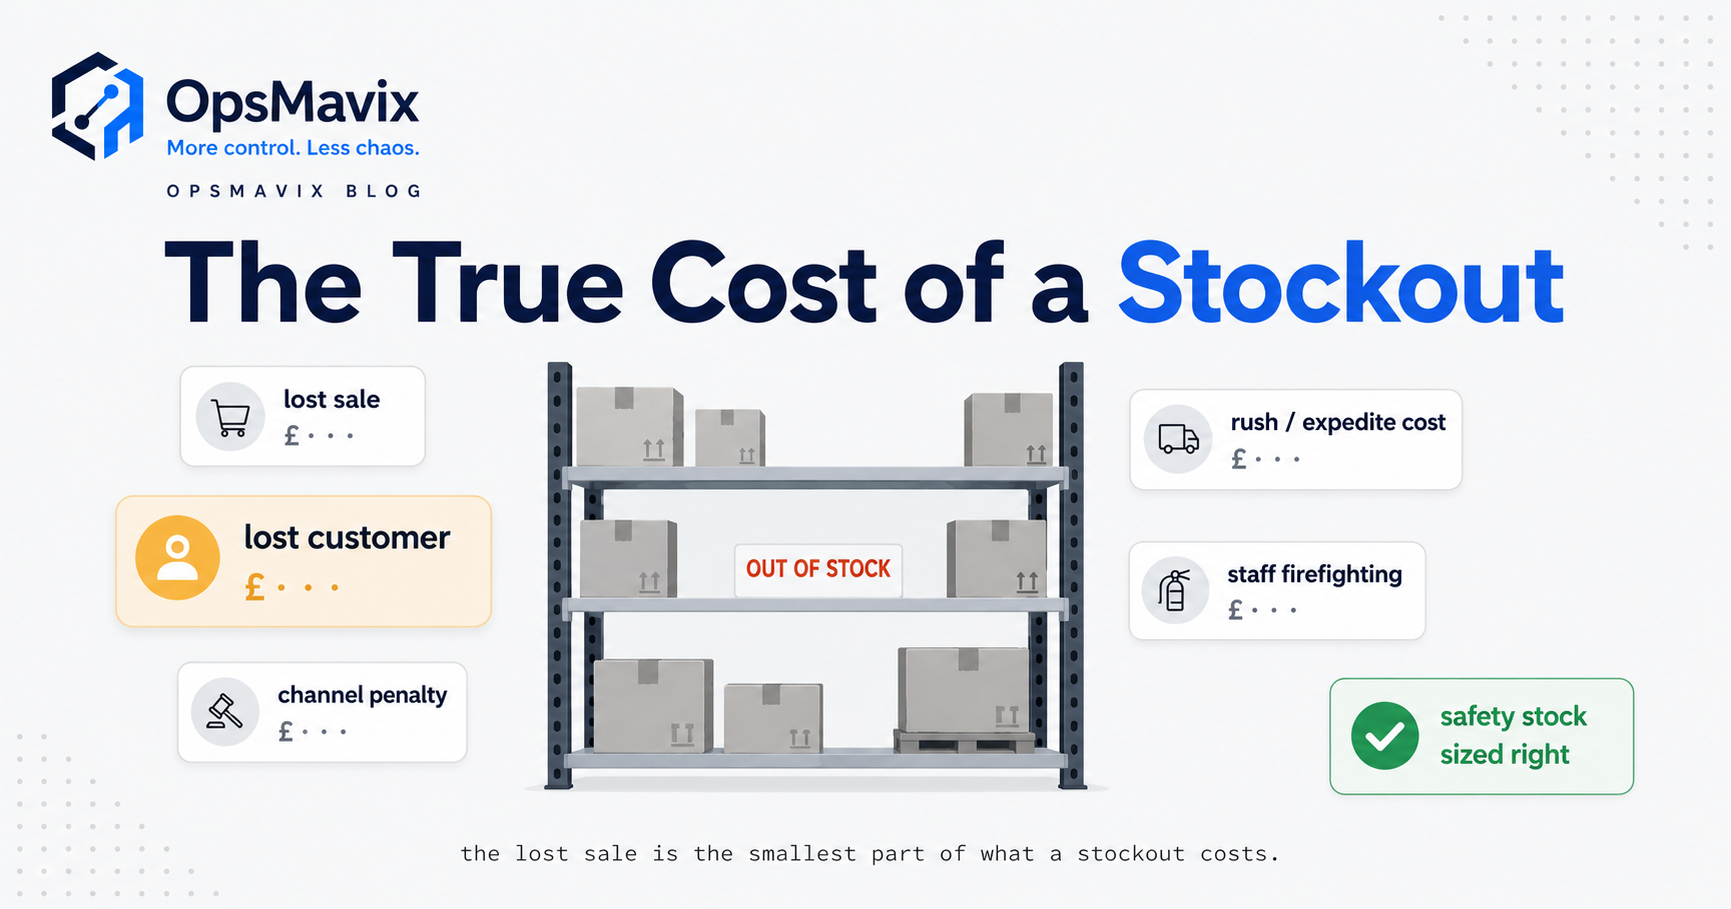
Quick summary: The cost of stockouts is almost never just the price of the sale you missed. The full cost is five layers stacked on top of each other — the lost contribution margin, the lifetime value of a customer who buys elsewhere and stays there, marketplace ranking and penalty damage where you sell on Amazon or eBay, the expedite and rush-freight cost of recovering, and the staff hours burned firefighting. For most small operations the hidden four layers dwarf the obvious one. You can estimate your own figure with a simple per-incident formula, and most of the recurring cost comes from two fixable failures: inaccurate stock records that cause phantom oversells, and safety buffers that are guessed rather than sized to real lead-time variability.
Below is the honest breakdown, a worked £ example you can copy, the important difference between a genuine stockout and an overselling failure, and the operational fixes that actually move the number.
Contents
- The lost sale is the cheapest part
- Layer 1: lost contribution margin, not lost revenue
- Layer 2: the lost customer (the expensive one)
- Layer 3: marketplace ranking and penalty damage
- Layer 4: expedite and rush-recovery cost
- Layer 5: the staff-firefighting cost
- A simple £ framework to estimate your own stockout cost
- A true stockout versus an oversell: they are not the same failure
- The operational fixes that move the number
- What to measure so the cost stops being invisible
The lost sale is the cheapest part
Ask most business owners what a stockout costs and they will say the same thing: “we lost the sale.” That framing is why the problem never gets prioritised. One missed sale of a £30 item sounds like £30 of damage — annoying, not urgent, and easy to file under “these things happen.”
The £30 figure is wrong twice over. It overstates the immediate loss, because £30 is revenue, not profit — you did not incur the cost of goods on a sale you did not make. And it massively understates the total loss, because it counts only the one layer you can see and ignores four you cannot. The visible layer is usually the smallest of the five.
The reason this matters is behavioural. A cost you cannot see does not get a budget to fix it. Owners will happily spend a day chasing a £200 supplier overcharge and leave a stockout pattern running for a year because nobody has ever put a number on it. The whole point of this page is to put a number on it, so the fix competes for attention on honest terms.
Layer 1: lost contribution margin, not lost revenue
Start by correcting the arithmetic downward, because credibility depends on it. When you stock out, you do not lose the selling price. You lose the contribution margin — selling price minus the variable cost of goods and the variable selling costs (payment fees, marketplace commission, pick-and-pack) you would have paid to fulfil it.
If that £30 item costs you £14 landed, carries a £4 marketplace fee and £2 of fulfilment, the sale you missed was worth about £10 of contribution, not £30. Anyone who tells you a stockout on it cost £30 is inflating, and inflated numbers get dismissed the moment someone checks them.
There is a second correction, this time upward: not every stockout is a permanent loss of the sale. Some customers wait, or take a substitute, or come back tomorrow. The fraction that is genuinely lost — as opposed to merely delayed — is the number that matters, and it varies enormously by product. A one-off gift bought in a hurry is gone the instant you are out. A consumable your customer buys every month from you specifically is more likely to wait. You need a rough capture-loss rate per category: of the demand you could not serve, what share walked and did not come back. Even a crude split — say 70% lost on impulse lines, 30% on staples — beats pretending it is either 0% or 100%.
Getting your true landed cost right is a prerequisite for all of this; if you are not sure what a unit actually costs you to have on the shelf, landed cost calculation is the place to start, because a margin figure built on the sticker cost of goods will mislead every calculation downstream.
Layer 2: the lost customer (the expensive one)
This is the layer that turns a rounding error into a real cost, and it is the one almost nobody counts.
When a customer cannot buy from you, they do not go home. They buy the same thing from a competitor. That transaction teaches them two things: that the competitor exists, and that the competitor had stock when you did not. For a one-off buyer that is a shrug. For a repeat customer it can be the moment the relationship quietly ends — not with a complaint, just with a habit forming somewhere else.
So the cost of some stockouts is not one lost margin. It is the remaining lifetime value of a customer who has now found an alternative and has no reason to switch back. If a good customer would have spent £400 of contribution with you over the next two years, and a stockout is what sent them to a rival they stuck with, that single empty shelf slot cost you £400, not £10.
You cannot apply this to every incident — most stockouts do not lose a customer for life, and claiming they do is exactly the kind of inflated maths that gets the whole argument thrown out. The discipline is to estimate a defection probability: what share of the customers you turned away are repeat-buyers you actually lose for good. It might be low — 2%, 5% — but multiply a small probability by a large lifetime value across a year of stockouts and it usually becomes the single biggest line in the total. This is the layer that should make you uncomfortable, because it is real, it is large, and it is invisible in every report you currently run.
Layer 3: marketplace ranking and penalty damage
If you sell on marketplaces, a stockout is not just a missed order — it is a signal to an algorithm and, often, a scored defect against your account. This layer has no equivalent on your own website, and it is why marketplace stockouts deserve their own line in the cost.
Two distinct kinds of damage sit here.
Ranking and visibility. Running out affects how the marketplace treats the listing going forward, not just during the outage. Marketplace search ranking favours listings that are in stock and ready to ship, because a listing that cannot fulfil is a poor result to put in front of a buyer — so an out-of-stock spell tends to cost you placement. A listing that loses placement does not always spring back the day stock returns; you can spend weeks buying your way back to a position you already held.
Scored penalties for the overselling case. If the stockout is a phantom one — you sold stock you did not physically have, then cancelled — the marketplace records that against your seller metrics. Amazon’s pre-fulfilment cancellation rate has a published threshold, and cancellations you initiate because you oversold count towards it. Cross the threshold and you are not looking at one lost order; you are looking at listing suppression or account-level action that costs you every sale across the catalogue. That failure mode is preventable, and the full playbook for it is in how to prevent overselling — but for costing purposes the point is that a marketplace stockout can carry a penalty a website stockout never will.
The practical consequence: the same product should carry a higher assumed stockout cost on a marketplace than on your own site, because the marketplace adds a ranking loss and a scored-penalty risk on top of the margin and customer layers.
Layer 4: expedite and rush-recovery cost
The costs so far assume you did nothing. In reality, a stockout on an important line usually triggers a scramble, and the scramble has a bill.
- Rush freight and premium supplier terms. Air instead of sea, courier instead of pallet, a small emergency order at a worse unit price than your normal quantity break. You pay a premium precisely because you left yourself no time.
- Partial and split shipments. Fulfilling what you can now and the rest later means paying to pick, pack and ship one order twice.
- Substitution at your expense. Shipping a higher-spec item at the lower price to keep a customer, or upgrading delivery for free as an apology.
- Discounting to recover goodwill. The voucher you send the customer who was let down is a direct, traceable cost of the outage.
Every one of these is money spent solely to undo a stockout that a correct reorder point would have prevented. Rush-recovery cost is the easiest of the hidden layers to quantify, because it usually leaves a receipt — the premium on the emergency purchase order, the extra courier line, the discount code redeemed. Total those over a quarter and you often find the recovery spend alone justifies fixing the underlying process.
Layer 5: the staff-firefighting cost
The last layer is time, and it is the one owners feel most and cost least. A stockout does not resolve itself. Somebody chases the supplier, somebody emails or phones the customer, somebody reslots the order, somebody handles the follow-up complaint, and somebody re-checks the stock figure that was wrong in the first place.
Price it honestly at a loaded hourly rate — salary plus overhead, not just take-home. An hour of a coordinator’s time spread across four people in fifteen-minute chunks is still an hour you paid for and got no output from. Worse, it is reactive time, which displaces the proactive work — the counting, the reordering, the supplier management — that would have prevented the next stockout. That is the doom loop: firefighting today’s outage is what leaves no time to prevent tomorrow’s, so the outages keep coming.
Across a busy period, a handful of stockouts a week at half an hour of blended firefighting each is a part-time salary spent on damage control. It never appears as a line item because it is buried inside wages you were paying anyway — which is exactly why it stays invisible until you deliberately count it.
A simple £ framework to estimate your own stockout cost
You do not need a data-science project. You need one repeatable per-incident estimate you can apply to a sample of real stockouts, then annualise. Here is the framework.
Per-stockout cost ≈
- Lost margin = units of demand you could not serve × contribution margin per unit × capture-loss rate (share genuinely lost, not delayed)
- plus Lost-customer cost = customers turned away × defection probability × remaining customer lifetime value
- plus Marketplace cost = estimated ranking/visibility loss + (penalty risk, if it was an oversell) — applies to marketplace channels only
- plus Recovery cost = rush freight + split-shipment + substitution + goodwill discounts actually spent
- plus Firefighting cost = staff hours spent × loaded hourly rate
Worked example — one week, one mid-tier SKU, figures illustrative:
| Layer | Working | Cost |
|---|---|---|
| Lost margin | 20 units unmet × £10 margin × 60% genuinely lost | £120 |
| Lost customer | 12 customers × 4% defection × £250 remaining LTV | £120 |
| Marketplace | ranking dip on the listing during and after the outage | £60 |
| Recovery | emergency PO premium £40 + split-shipment £15 | £55 |
| Firefighting | 2.5 hours × £22 loaded rate | £55 |
| Total for one stockout week on one SKU | £410 |
The naïve “we lost the sale” figure for that same week was 20 units × £30 sticker = £600 of imagined revenue, which the owner mentally discounted to “not worth chasing.” The honest figure is £410 of real cost — lower headline, but actual money, and more than half of it (£290) sits in layers that never show up in any report. Run that across the SKUs that stock out repeatedly and the annual number is the business case for the fix, sitting in plain sight.
Two rules keep this credible. Use contribution margin, never revenue — inflated inputs get the whole estimate dismissed. And be conservative on the probabilistic layers (capture-loss and defection); a defensible small number beats an impressive large one you cannot stand behind.
A true stockout versus an oversell: they are not the same failure
This distinction changes which fix you reach for, so it is worth being precise.
A true stockout is an honest zero. You genuinely have no units, your system correctly shows zero, and you stop selling. The customer sees “out of stock” and you lose the demand cleanly. Painful, but truthful — and the fix is on the supply side: order sooner, hold more buffer, forecast better.
An oversell — phantom stock — is a lie your data told. Your system shows units available that do not physically exist, so you accept an order you cannot fulfil and have to cancel it. This is far more expensive per incident, because it adds the marketplace penalty layer, a specific let-down customer with a specific order to unwind, and a refund, on top of everything a true stockout costs. And it is caused by data, not supply: an inaccurate stock record, a sync lag between sales channels, a return never put back, a count that was never done.
The reason this matters for cost: throwing more safety stock at an oversell problem does nothing, because you were never actually out — your number was wrong. Conversely, tightening your data will not help if you genuinely cannot keep up with demand. Diagnose which failure you have before you spend a penny fixing it. If your “stockouts” happen while stock is physically sitting in the building, you have an oversell problem, and the answer is accuracy, not more inventory.
The operational fixes that move the number
Once you know your real cost and which failure you are dealing with, the fixes are unglamorous and well understood. There are four, in dependency order.
1. Get the stock record accurate first. Every other fix is built on the number in your system, and if that number is wrong, safety stock and reorder points just automate the error. The foundation is a trustworthy stock record — one source of truth, updated as goods move, with returns put back and receipts booked in. Accuracy is what kills the oversell (phantom-stock) failure at the root. If stock is genuinely wrong today, you count before you calculate anything.
2. Size safety stock to real lead-time variability — do not guess it. Safety stock is the buffer that absorbs the two things that cause honest stockouts: demand spiking above forecast, and supply arriving later than promised. Most small operations pick a round number (“keep 20 spare”) that is simultaneously too high on steady lines (tying up cash and inviting dead stock) and too low on volatile ones (the ones that actually stock out). The buffer should be derived from measured variability, especially the variability of your supplier’s lead time — a supplier who is sometimes two weeks late needs more cover than one who is reliably on time, regardless of average. The method is in safety stock calculation.
3. Set reorder points that fire in time. A reorder point is the stock level at which you place the next order — high enough that what remains carries you through the lead time (plus safety stock) before the new delivery lands. Get this right and you refill before you hit zero, so the true stockout never happens. Get it wrong — or leave it to memory — and you are permanently reacting. The calculation, including lead-time demand, is in how to calculate reorder point.
4. Give each sales channel its own buffer against sync lag. If you sell in more than one place, a stock update takes time to propagate from the channel that sold a unit to the channels that must stop selling it. During that gap you can oversell even with a perfectly accurate warehouse figure. A small per-channel buffer — larger on marketplaces that penalise cancellations — covers the latency window. This is a different animal from safety stock: it protects against sync delay, not demand uncertainty, and it is the specific fix for the “why do we keep overselling on Amazon” question.
Notice the order. Accuracy first, because it underpins everything and fixes the expensive oversell case. Then safety stock and reorder points, which prevent honest stockouts. Then channel buffers, which handle the multichannel edge case. Doing them out of order — buffering on top of a wrong number, for instance — just hides the problem somewhere more expensive to find.
What to measure so the cost stops being invisible
The reason stockouts persist is that they are absences, and absences do not show up in a sales report — you cannot see the order that never happened. Make the cost visible and it starts getting fixed. Track four things:
- Stockout frequency and duration by SKU. Which lines run out, how often, and for how long. The Pareto pattern is brutal: a small handful of SKUs usually generate most of the total cost, and they are where every fix above should point first.
- Oversell/cancellation rate by channel. Rising cancellations are the fingerprint of the phantom-stock failure, and they are the most expensive incidents you have. Watch marketplace channels especially.
- Stock-record accuracy. The percentage of locations where system quantity matches a physical count. This is the leading indicator for oversells — accuracy falls before cancellations rise.
- Recovery spend. Total the rush freight, split shipments, substitutions and goodwill discounts. It is the easiest hidden cost to capture because it leaves receipts, and it is often enough on its own to justify the fix.
Once these four are in front of you weekly, the annual cost of stockouts stops being a shrug and becomes a number with your name against it — which is the only state in which it reliably gets fixed.
The takeaway is not that stockouts are catastrophic — most single incidents are survivable, and treating every empty shelf as a disaster is its own kind of dishonesty. It is that the true cost lives in the four layers you never see, that oversells are a distinct and more expensive failure than honest stockouts, and that both are the predictable output of guessable, fixable process gaps: an inaccurate stock record, an unsized buffer, a reorder point left to memory, a channel with no headroom. Put a number on the cost, diagnose the failure, and fix the layers in order.