
Supplier Lead Time: How to Measure It, Why Variability Hurts, and How to Reduce It
Supplier lead time is the clock from placing an order to the goods being sellable on your shelf — and it is the number that quietly sizes your safety stock, your reorder points and the cash frozen in buffer. This guide breaks it into its four components, shows how to measure it from your own purchase-order and goods-received dates, explains why the variability matters far more than the average, and gives the practical levers that reduce and stabilise it.
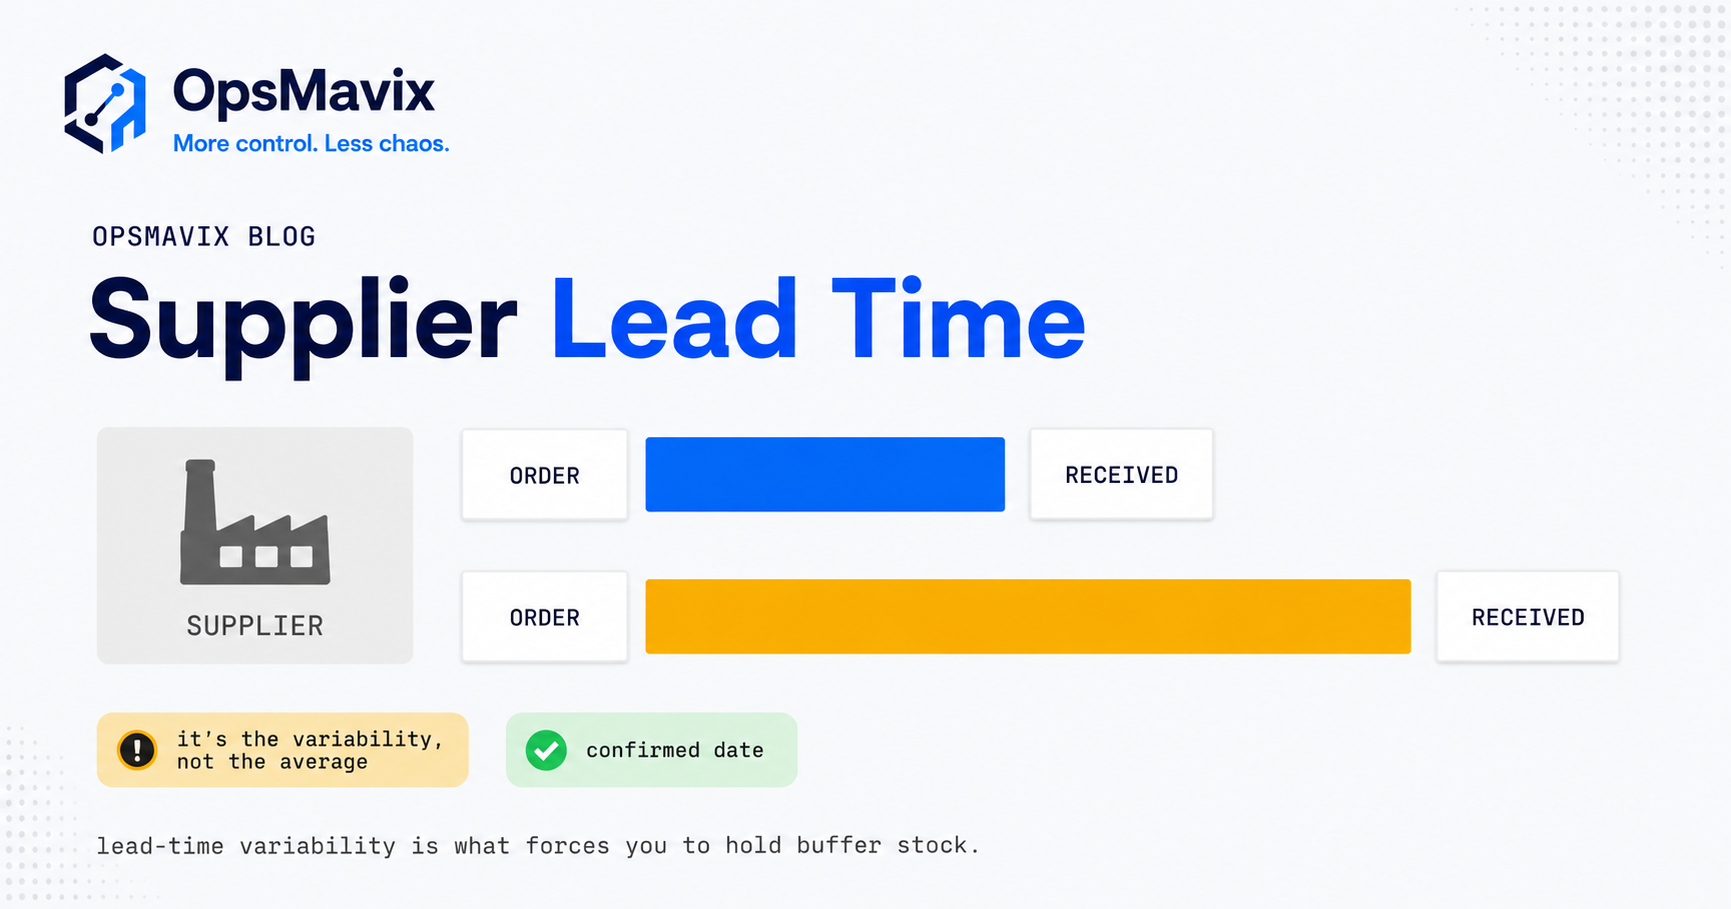
Quick summary: Supplier lead time is the full elapsed time from the moment you place a purchase order to the moment the goods are booked in and sellable — made up of order processing, production, transit and receiving. Measure it from your own PO and goods-received dates in working days, not from the courier tracking or the supplier’s promise. The number that actually costs you money is not the average lead time but its variability: an unreliable supplier forces a bigger safety-stock buffer and an earlier reorder point, which ties up cash that a steady supplier on the same average would not. You reduce and stabilise it by consolidating suppliers, capturing confirmed dates, buying on a regular cadence, and dual-sourcing long-lead lines locally.
Most businesses treat supplier lead time as a single number a buyer half-remembers — “that lot take about a fortnight”. That guess then silently sets the reorder points, the buffer stock and the promises you make to customers. When the guess is optimistic, you run dry; when it is padded, you drown working capital in stock you did not need. Either way the number is doing real work and nobody is measuring it.
This page is about doing exactly that: pinning supplier lead time down as a measurable, break-it-into-parts quantity, and then showing why the spread of it — not the middle of it — is what your safety stock is really paying for.
Contents
What supplier lead time actually is
Supplier lead time is the whole clock from “order placed” to “stock sellable”, not the bit the courier is responsible for. The single most common error is measuring only the transit leg — “it ships in three days” — and ignoring the days the order sat waiting to be processed, the weeks it spent in production, and the time it took your own goods-in to count it and book it in. Every one of those legs is time you cannot sell the product, and all of it belongs in the number.
It splits cleanly into four components:
- Order processing. The gap between you sending the PO and the supplier actually acting on it — acknowledging it, allocating stock or scheduling a production slot. For a supplier who batches orders weekly, this alone can be five days before anything moves.
- Production or picking. For a make-to-order supplier this is the build time; for a stock supplier it is picking and packing. This is usually the longest and most variable leg on manufactured or imported lines.
- Transit. The physical movement — courier, freight, customs clearance on imports. Predictable domestically, wildly variable across borders.
- Receiving. Your own goods-in: unloading, counting, inspecting, and booking the stock into the system so it is available to sell or build with. Goods sitting in a receiving bay unbooked are not yet inventory, and this leg is the one businesses forget is theirs to control.
The reason to split it is diagnostic. A lead time that is too long is a different problem depending on which leg is bloated. If order processing dominates, the fix is a standing schedule with the supplier. If receiving dominates, the fix is your own dock, not the supplier at all. A single blended number hides which lever to pull.
How to measure supplier lead time from your own data
You do not need the supplier to tell you their lead time. You already have the evidence, sitting in two dates you record on every order: when the purchase order was placed, and when the goods were booked in. The gap between them, counted in working days, is the actual lead time for that order. Do it across a supplier’s order history and you have something far more useful than a promise — you have their track record.
The two dates that matter:
- PO date — when the order was placed (use the sent date, not the raised-but-unsent date).
- Goods-received date — when the delivery was booked in on the goods received note, not when the lorry arrived at the gate. Booked-in is the moment stock becomes sellable, which is the honest end of the clock.
Count the difference in working days, not calendar days, and take bank holidays out — a 15-working-day lead time is three weeks, and a public holiday in the middle pushes it a day further. Then do this for every completed order from that supplier over a sensible window (the last six to twelve months) and you get a distribution, not a point.
Here is what one supplier’s recent history might look like. Figures are illustrative; the method is the point.
| PO | Ordered | Booked in | Lead time (working days) |
|---|---|---|---|
| PO-1041 | 6 Jan | 20 Jan | 10 |
| PO-1078 | 3 Feb | 24 Feb | 15 |
| PO-1103 | 2 Mar | 13 Mar | 8 |
| PO-1147 | 7 Apr | 5 May | 20 |
| PO-1189 | 6 May | 20 May | 10 |
| PO-1226 | 8 Jun | 19 Jun | 9 |
The average is 12 working days. But look at the spread: the fastest order landed in 8 days, the slowest in 20. If you set your buffer to the 12-day average, roughly half your orders arrive later than you planned for — and PO-1147’s 20-day slip is the kind of event that empties a shelf. The average tells you what to expect on a good run. The spread tells you what to protect against. You need both recorded, and only a system that stamps and keeps those two dates on every order can give you either.
Why the average lead time lies
Here is the trap. Two suppliers can have an identical average lead time of 10 working days and be completely different risks. Supplier A lands every order in 9, 10 or 11 days — rock steady. Supplier B averages 10 too, but individual orders come in anywhere from 6 days to 18. Same average, opposite reality. Plan against the average for both and you will be roughly right on A and badly exposed on B, because B’s late orders are exactly the ones that catch you with an empty shelf.
This is why variability, not the mean, is the number that costs you. Your safety stock exists to cover the difference between the expected lead time and the bad one. If there is no spread, there is almost nothing to buffer against. If the spread is wide, you have to hold enough stock to survive the worst plausible delay every single order cycle — and you hold that buffer permanently, on every line, whether the delay happens this cycle or not.
An average is a comfortable number because it feels like knowledge. But a supplier who is “10 days on average” by being 6 days half the time and 18 days the other half is not a 10-day supplier in any way that helps you plan. The variability is the thing your cash is quietly paying to insure against, and it is invisible until you record the spread rather than the mean.
How variability drives safety stock and reorder point
This is where supplier lead time stops being a procurement curiosity and starts setting your working capital. Two of the most important inventory numbers you hold are built directly on it.
The reorder point — the stock level that triggers a new order — is expected demand over the lead time, plus a safety buffer:
Reorder point = (average daily demand × average lead time) + safety stock
The full trigger logic, including how much to bring in when it fires, is covered in how to calculate reorder point. What matters here is the second term. That safety-stock buffer is sized largely by how much the lead time varies — the more a supplier’s delivery time swings, the bigger the buffer has to be to survive the late case. The full sizing method lives in safety stock calculation; the short version is that a wider lead-time spread means a fatter, more expensive buffer, held on every unit, all the time.
So the chain runs in one direction and it is unforgiving: higher lead-time variability → bigger safety stock → an earlier reorder point → more cash frozen on the shelf. An unreliable supplier does not just annoy your buyer. They quietly raise the amount of your money that has to sit in stock, permanently, on every line they supply — and they do it without ever appearing on an invoice.
What variability really costs in cash
Put numbers on it. Say you sell 50 units a day of a line, and it costs you £8 a unit. Two suppliers can both deliver it, both averaging a 10-working-day lead time.
- Supplier A is steady: every order lands in 9 to 11 days.
- Supplier B averages 10 but has hit 18 days when a production slot slipped.
The buffer you need is roughly the demand across the extra delay you have to survive beyond the average:
| Supplier A (steady) | Supplier B (erratic) | |
|---|---|---|
| Average lead time | 10 days | 10 days |
| Worst realistic lead time | 11 days | 18 days |
| Days of delay to buffer | 1 | 8 |
| Safety stock (50/day × delay) | 50 units | 400 units |
| Buffer cash tied up (× £8) | £400 | £3,200 |
| Reorder point ((50×10) + buffer) | 550 units | 900 units |
Same product, same average lead time, same demand — and Supplier B forces £2,800 more cash to sit frozen on the shelf, on this one line, forever. Multiply that across a catalogue of a few hundred lines from an unreliable supplier and the variability is funding a five- or six-figure pile of buffer stock whose only job is to absorb one supplier’s inability to hit a date. The reorder point jumps too, from 550 to 900, so you are also carrying more stock on average between deliveries. That is the true price of variability, and it never shows up as a line item — it shows up as “we always seem to have a lot of cash in stock”.
The corollary is the useful bit: stabilising a supplier is worth cash even if the average never improves. Getting Supplier B from an 8-day swing down to a 2-day swing releases most of that £3,200 back into working capital, without renegotiating a single price or shaving a single day off the average.
Levers to reduce and stabilise supplier lead time
Two different goals hide inside “improve our lead times”, and they call for different moves. Reducing the average shortens the clock. Stabilising it narrows the spread. As the worked example showed, stabilising is often the bigger cash win, because it is the spread your buffer is paying for. Here are the practical levers, roughly in order of effort-to-payoff.
Consolidate suppliers
Every supplier is a separate lead time, a separate reliability record and a separate minimum order. Spreading the same spend across eight suppliers where three would do multiplies the number of variability sources you have to buffer against. Consolidating onto fewer, higher-volume relationships gives you priority in their production queue, more predictable slots, and a track record deep enough to actually measure. Fewer suppliers, better data, tighter spread.
Capture confirmed dates, not just promises
Most lead-time slip is not the supplier being slow — it is the supplier quietly moving the date and nobody in your system knowing. You ordered for the 8th, they acknowledged the 15th, and the first anyone hears of it is when the shelf is empty on the 9th. Capturing the acknowledged delivery date on every order, and flagging when the actual receipt misses it, turns silent slippage into a visible, chaseable event. This is the single cheapest stabiliser available, and it is the core of running the inbound side properly — see supplier order management software for what that tracking looks like end to end, and purchase order tracking system for the mechanics of watching an open order from sent to received.
Buy on a regular cadence
Erratic ordering produces erratic lead times. If you place orders whenever someone notices the shelf is low, you land in the supplier’s queue at random and take whatever slot is free. A standing schedule — a set order day each week or each month — lets the supplier plan for you, reserve capacity, and hit a consistent turnaround. Cadence on your side buys predictability on theirs. It also collapses the order-processing leg, because the supplier is expecting the order rather than reacting to it.
Dual-source and localise the long-lead lines
The lines that hurt most are the long-lead, single-source, imported ones — a 40-day lead time with customs risk and one supplier is a shelf-emptying event waiting for a bad week. You do not need to dual-source everything; you need to dual-source the handful of items where a slip stops sales or stops a build. A local secondary supplier, even at a higher unit price, is often cheaper than the buffer stock the long-lead primary forces you to hold — and it caps the worst-case delay, which is the number your safety stock is sized on.
Measure, then hold suppliers to it
None of the above sticks without measurement. Once you are recording actual lead time and on-time percentage per supplier from your own PO and GRN dates, you can have the conversation backed by their own record rather than a vague complaint, move volume towards the reliable ones, and set your reorder points against real lead times instead of optimistic ones. The measurement is not admin — it is the lever that makes every other lever real.
Which to chase first
Given a choice, chase the spread before the average. A supplier who takes a steady 15 days is easy to plan around — you hold 15 days of cover and you are done. A supplier who takes “somewhere between 8 and 22 days” forces you to hold for 22 every time, so their effective lead time, as far as your cash is concerned, is the worst case, not the average. Narrowing that supplier to a reliable 15 days releases buffer even though the average went up.
That is the counter-intuitive lesson buried in supplier lead time: the reliable slow supplier can cost you less in tied-up cash than the fast-but-erratic one. Plan against reliability, and treat unpredictability as the expensive fault it is. When you next review suppliers, rank them by the spread of their lead times, not the middle of it — that is the list sorted by how much of your working capital each one is quietly consuming.
FAQ
What is supplier lead time?
Supplier lead time is the total elapsed time from placing a purchase order to the goods being booked in and sellable on your shelf. It has four components — order processing at the supplier’s end, production or picking, transit, and your own receiving. The common mistake is measuring only the transit leg; the days an order waits to be processed, and the time your goods-in takes to count and book it in, are part of the lead time too.
How do you calculate supplier lead time?
Measure it from your own records: the working days between the purchase-order date and the date the delivery was booked in on the goods received note. Do that across a supplier’s last six to twelve months of completed orders and you get both an average and, more importantly, a spread. Count working days rather than calendar days and take bank holidays out, because a 15-working-day lead time is three weeks and a public holiday pushes it further.
Why does lead-time variability matter more than the average?
Because your safety stock exists to cover the difference between the expected lead time and the bad one. Two suppliers with the same 10-day average are different risks if one is steady and the other swings from 6 to 18 days — the erratic one forces a much bigger buffer, held permanently on every line, to survive its late orders. The average tells you what to expect on a good run; the spread tells you what to protect against, and the buffer is sized on the spread.
How does supplier lead time affect the reorder point?
The reorder point is average daily demand multiplied by average lead time, plus safety stock. So a longer average lead time raises the base level at which you reorder, and higher lead-time variability raises the safety-stock term on top. An unreliable supplier therefore pushes your reorder point up in both terms, meaning you trigger orders earlier and carry more stock between deliveries. The full method is in how to calculate reorder point.
How do you reduce supplier lead time?
Separate reducing the average from stabilising the spread — the second is usually the bigger cash win. Consolidate onto fewer suppliers so you get priority and deeper data, capture confirmed delivery dates so slippage is visible and chaseable, order on a regular cadence so the supplier can plan for you, and dual-source or localise the long-lead single-source lines where a slip stops sales. Underpinning all of it, measure actual lead time and on-time percentage per supplier so you can move volume towards the reliable ones.