
ProLink Software Alternative: When Quality Data Needs to Meet Production
ProLink is SPC and quality-data-collection software, and for capturing measurements and running control charts it does a real job. The trouble for a growing manufacturer is that the quality data often ends up in its own silo — cut off from the job, the machine, the scrap and the wider production picture. Here's where SPC software fits, why siloed quality data is a missed chance, and what a system that treats quality as part of the operation changes.
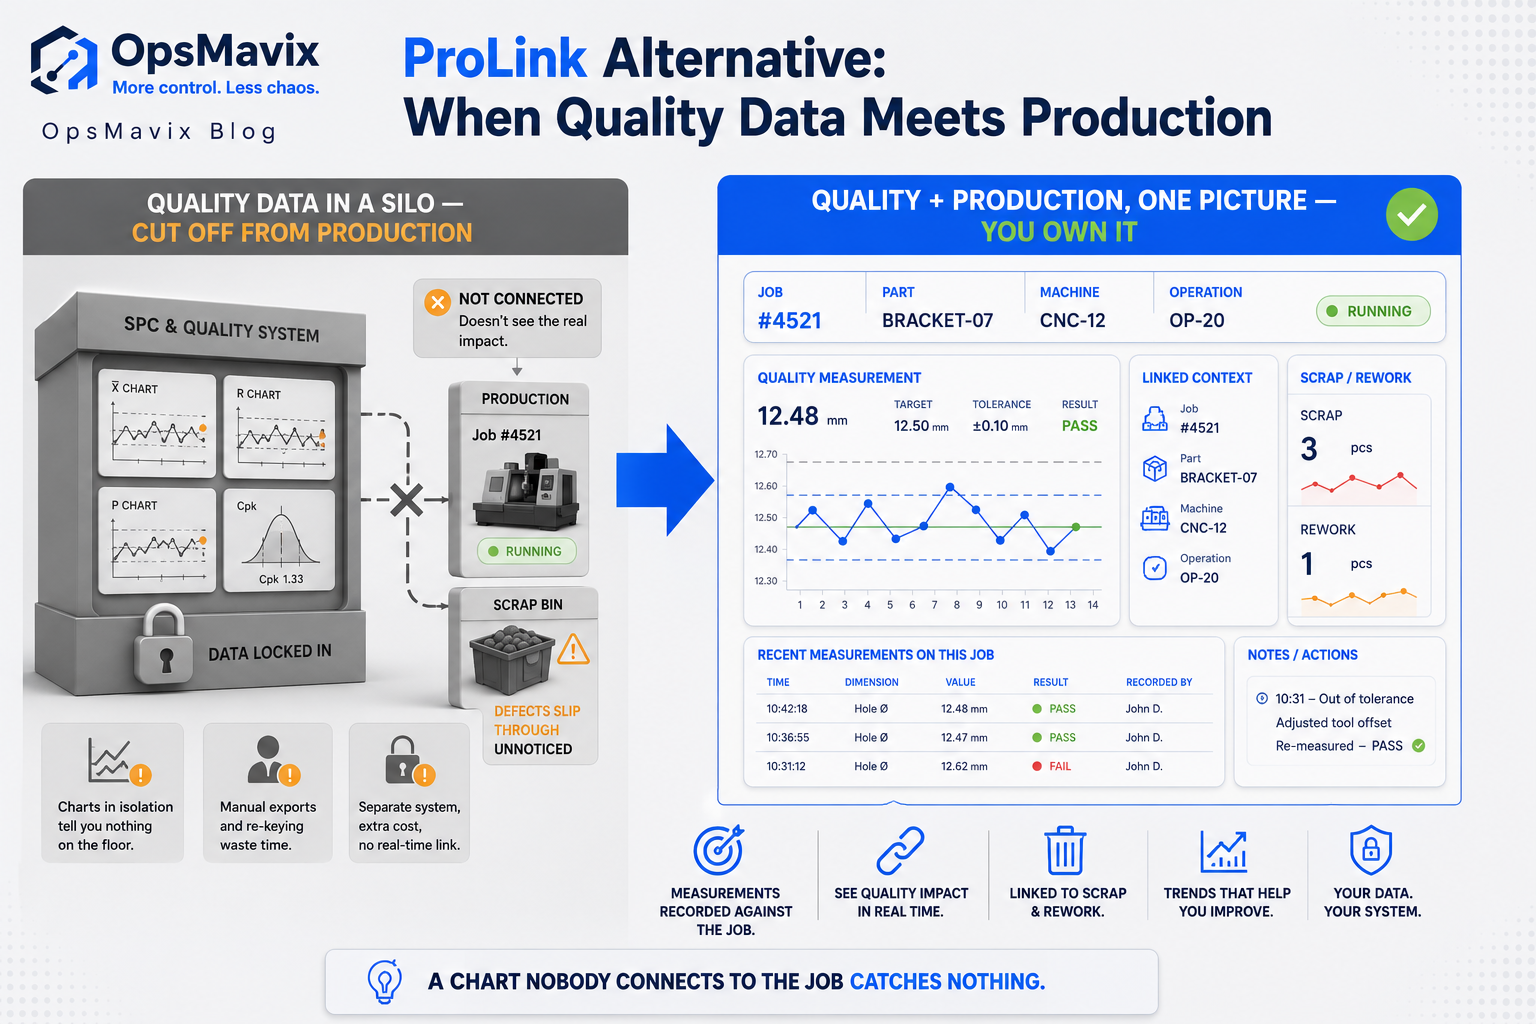
A ProLink software alternative is any system that captures quality measurements without leaving that data stranded from the rest of your operation. ProLink is SPC (statistical process control) and quality-data-collection software, built to pull measurements off gauges and instruments, plot them on control charts, and hold a record of how a process behaves over time. For what it’s built to do, it does a genuine job: it turns readings into charts that tell normal variation from a real shift, and it gives quality a paper trail. You start looking for an alternative not because the charts are wrong, but because the quality data ends up living in its own world — separate from the job that produced it, the machine it ran on, and the scrap it caused.
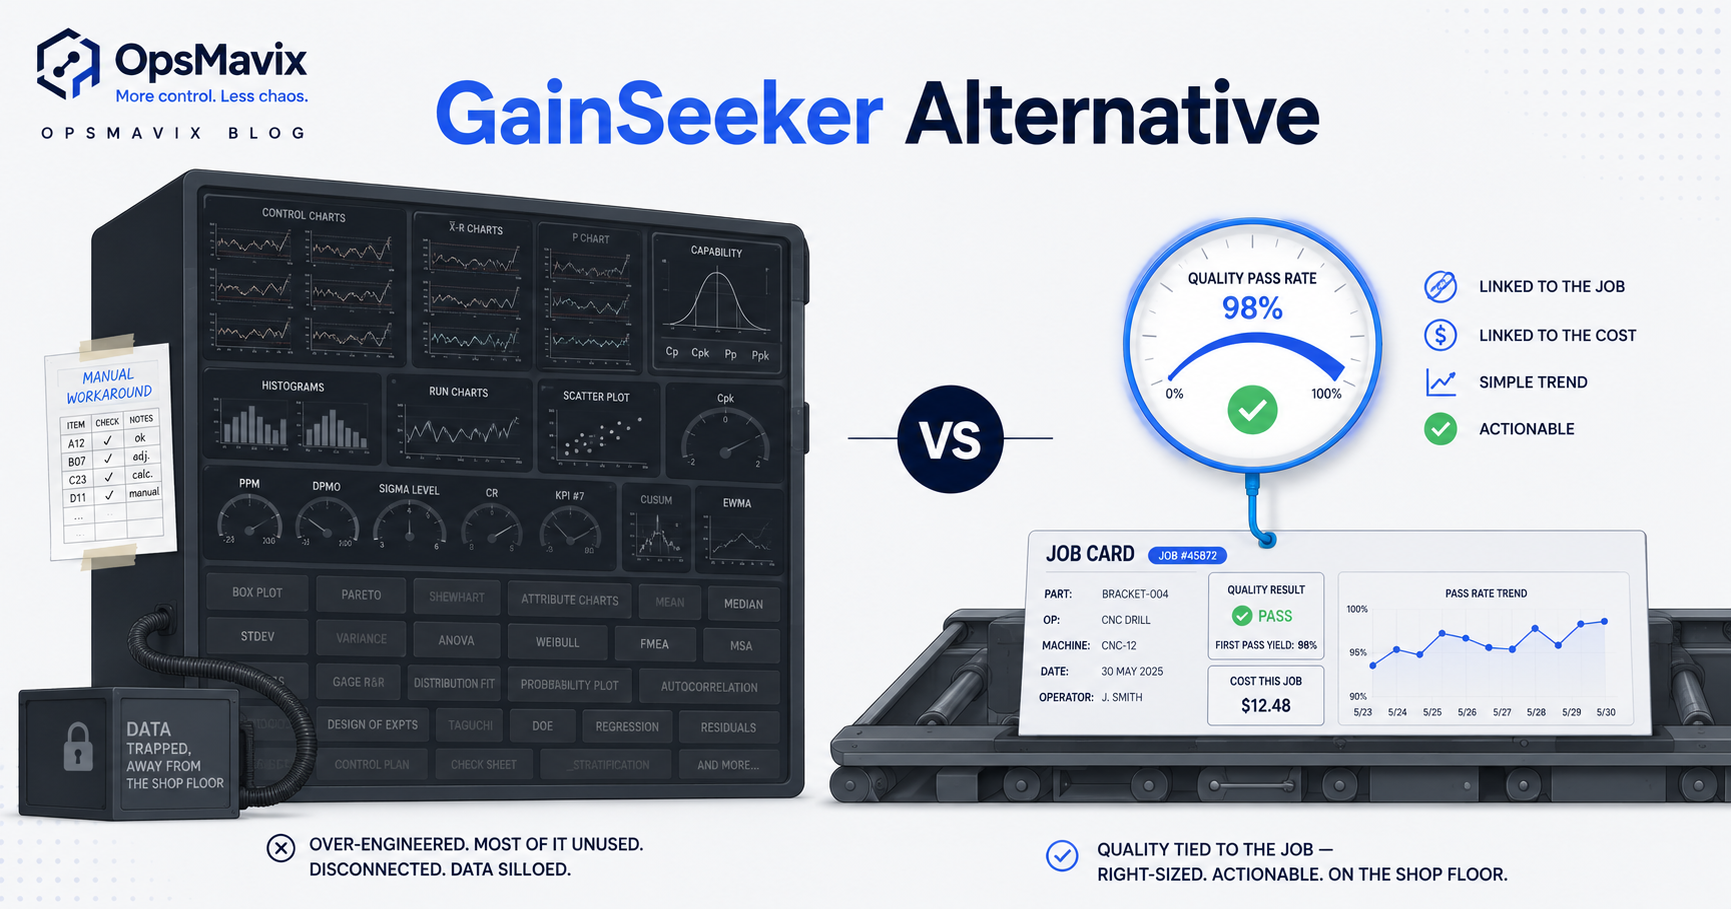
This post covers what SPC and quality software does well, why quality data walled off from production is a missed opportunity for a growing manufacturer, and what changes when quality is built into the operational picture instead of parked beside it. If you’re weighing whether you need a shop-floor system at all, the manufacturing execution system explainer covers that wider layer. If you’re comparing SPC tools specifically, our GainSeeker alternative looks at the same trade-off from another angle.
Key Takeaways
- ProLink sits in the SPC / quality-data-collection category — strong at capturing measurements and turning them into control charts.
- SPC software earns its place when your process genuinely runs on control charts and capability data, and someone acts on the signals.
- The common gap for a growing manufacturer: quality data ends up in its own silo, disconnected from the job, machine, scrap and order it belongs to.
- Siloed quality data means slower reaction — a drifting process shows on a chart nobody has open, and the connection to the batch it spoiled is lost.
- A custom system records quality against the job and part, in the same place as production, so a failed check ties to the work, cost and downtime it caused.
- The aim isn’t fancier charts — it’s fewer defects escaping, faster reaction, and one connected picture of what the floor is actually doing.
1. What SPC and Quality Software Does Well (the honest bit)
Be fair to the category first. Statistical process control is a real discipline, and software built for it does something a spreadsheet can’t fake. It collects measurements straight off gauges and instruments, plots them on control charts, and flags when a process moves from ordinary variation into a genuine shift you should act on. It runs capability studies, holds a rigorous history, and gives you the record an auditor or a demanding customer expects to see. If your work is regulated, tight-tolerance, or high-volume enough that the statistics drive real decisions, a dedicated SPC tool is the right tool and a general system won’t out-analyse it.
So the honest filter is simple. If you can point to control-chart signals your line acts on every week — not “would be nice to have,” but “we caught a drift and adjusted because the chart told us to” — then the depth ProLink-type software offers is the job, not overkill. The question this post is really about isn’t whether SPC software is good at statistics. It’s what happens to that quality data after it’s captured.
2. The Silo Problem: Quality Data That Sits by Itself
Here’s the failure mode that sends a growing manufacturer looking for an alternative. The measurements get captured, the charts get drawn — and then the whole thing sits in its own application, on its own screen, watched by its own person. The quality data is accurate. It’s just alone. It doesn’t know which job produced it, which machine ran it, or what happened to the batch afterwards. A control chart shows a process drifting; nothing on that chart tells you the same drift is the reason forty parts went to the scrap bin an hour later.
That separation is the missed opportunity. Quality is not a standalone activity — it’s a property of a specific part, made on a specific machine, on a specific job, for a specific order. When the quality record lives apart from all of that, every question that matters becomes a manual cross-reference: which order did this failed check affect, what did the scrap cost, was the machine already flagged for something else. The data exists. The connections don’t.
3. Siloed Quality Means Slower Reaction
The point of catching a process drift is to react before it costs you. A silo blunts exactly that. If the quality data lives in one tool and the production picture lives everywhere else, the signal and the response are in different rooms. The chart might show the shift in real time — but if the person running the job can’t see it without opening another system they don’t have open, the reaction waits until someone notices, which is often after the batch is done and the bad parts have moved on.
The gap widens as you grow. One quality manager we spoke to described the pattern plainly: the SPC screen would show a trend heading out of tolerance, but by the time it was reviewed and traced back to a specific run, the run was finished and the parts had already gone downstream. The measurement was captured perfectly. The reaction was slow because the data had to be carried, by hand, from the quality world into the production world. Speed of reaction is where siloed quality data quietly costs the most, and it never shows up as a line item.
4. A Concrete Shop-Floor Scenario
Picture a run of machined parts on a CNC job. Every so often an operator pulls a part, measures a critical dimension, and the reading goes into the SPC tool. Three readings in a row edge toward the upper limit — a classic early warning. In a connected setup, that trend is visible right next to the job on the floor, the operator sees it, the tool is checked, and the run is corrected before anything is scrapped. Total damage: a few minutes and zero bad parts shipped.
Now the siloed version of the same story. The readings go into the quality application. The operator finishes the run. Nobody opens the chart until the quality review the next morning, by which point the trend has crossed the limit, roughly two hundred parts are out of tolerance, and a chunk of them have already been packed against a customer order. The measurement did its job. The organisation didn’t get to use it in time — because the data was captured in one place and needed in another. Same readings, same software, completely different outcome, decided entirely by whether quality was connected to production or fenced off from it.
5. Off-the-Shelf SPC vs Quality as Part of the Operation
An off-the-shelf SPC package is built to be excellent at one slice: capture, chart, record. That’s its strength and its boundary. It’s designed to be the quality system, which is precisely why it tends to become a silo — it owns the measurement and hands the rest of the floor nothing. Bolting it onto your production picture usually means exports, re-keying, or a spreadsheet someone maintains to link a failed check back to the job and the scrap it caused. Every one of those joins is manual, and every manual join is a place the connection breaks.
A system where quality is part of the operational picture flips the default. The check is recorded against the job, the part and the machine, in the same place production is already tracked — so a failed measurement automatically ties to the run it belongs to, the scrap and rework it generated, and the order it threatens. You still get the chart. You also get the thing the standalone tool can’t give you: the answer to “what did this cost, and what caused it,” without a single export. Quality stops being a separate discipline you check on and becomes one column in the picture of what the floor actually did, sitting alongside OEE monitoring and output on the same production tracking view.
6. What Connected Quality Actually Changes
The outcome of connecting quality to production isn’t a better-looking chart — it’s a shorter distance between a problem and someone acting on it. When a measurement is recorded against the live job, the trend is visible to the person who can fix it, on the screen they already have open, while the run is still going. Fewer defects escape because the warning and the response are in the same place. And when something does go wrong, the trace is instant: this failed check, on this job, on this machine, cost this much scrap, against this order — no cross-referencing three systems to reconstruct it.
That connection also changes what you learn. A silo tells you a process drifted. A connected system tells you which machine drifts most, which jobs it hurts, and what the pattern costs over a month — because the quality data is finally sitting next to the production and scrap data it needs to be read against. You stop investigating incidents one at a time and start seeing the shape of where quality actually leaks.
7. When to Keep the Dedicated Tool — and When to Build
This isn’t “SPC bad, custom good.” If your business runs on deep statistical work — capability indices customers demand, formal analysis auditors expect, control-chart discipline that genuinely drives your line — a dedicated SPC engine does that better than a general system will, and you shouldn’t ask a built-for-you tool to replace the statistics. The two aren’t always mutually exclusive either; the deciding question is where the pain actually is.
If your real problem is depth of statistics, keep the dedicated tool. If your real problem is that accurate quality data is stranded from the job, the machine, the scrap and the order — so reactions are slow and defects escape — then the fix isn’t a better statistics package. It’s a system that treats quality as part of the operation. Most growing manufacturers we see have the second problem, not the first: the measurements are fine, the connection is missing. Match the tool to the pain and the decision makes itself.
FAQ
What is the best ProLink software alternative?
There isn’t one universal answer — it depends on where your pain is. If you genuinely need deep statistical process control and someone acts on control-chart signals every week, a dedicated SPC tool in ProLink’s class is the right buy. If your measurements are already accurate but the quality data sits in its own silo, disconnected from the job, machine and scrap, then the better alternative is a custom system that records quality as part of production, so a failed check ties to the run, cost and order it belongs to. The tell is whether your problem is statistics or connection.
How is a custom quality system different from SPC software?
An SPC package is built to be excellent at capture, charting and record-keeping — and to be a standalone quality system. A custom system records the same checks against the job, part and machine, in the same place production is already tracked, so quality connects automatically to scrap, downtime and the order it affects. You still get the chart; you also get the trace and the cost, without exports or a linking spreadsheet. The difference is whether quality lives beside your operation or inside it.
Do I still need dedicated SPC software?
Possibly — be honest about your quality work. If it’s regulated, tight-tolerance or high-volume enough that capability studies and control-chart analysis drive real decisions, keep the dedicated engine; a general system won’t match its statistics. If you mostly need quality checks captured and connected to production so you react faster, a custom system fits better. The two can coexist, and if the dedicated tool is genuinely earning its place, we’ll say so.
Will connecting quality to production reduce defects that escape?
That’s the main reason to do it. When a measurement is recorded against the live job and visible to the person running it, a drifting process gets caught and corrected while the run is still going — instead of at a quality review the next morning, after bad parts have shipped. The measurement being accurate was never the issue; getting it in front of the right person in time is, and connection is what closes that gap.
How do I know my quality data is siloed?
The signs are practical: to answer “which order did this failed check affect,” someone opens two or three systems and cross-references by hand; scrap from a bad run isn’t linked to the quality reading that predicted it; the SPC screen is watched by one person and invisible to the operators who could act; and you learn about drifts at a review rather than in the moment. Those all mean the data is accurate but stranded — captured in one place, needed in another.
How OpsMavix Can Help
OpsMavix builds custom manufacturing and production-tracking systems where quality is part of the operational picture, not a silo beside it — measurements recorded against the job, part and machine, control-chart signals visible to the people who can act on them, and every failed check tied automatically to the scrap and rework it caused and the order it threatens. You keep the charts you rely on; you gain the trace, the cost and the fast reaction a standalone tool can’t give you.
If your quality data is accurate but stranded from production — slow to react, hard to cost, disconnected from the job that spoiled — that middle ground is exactly what we build. Book a Free Operations Leak Audit
Keep reading
Getting value from OpsMavix? Add us as a preferred source on Google — you'll see more of our operations content in your AI Overviews, AI Mode and Search.