
Short-Term Demand Forecasting Example: One SKU, Real Numbers, One Reorder Decision
Most demand-forecasting articles explain the theory and stop. This one runs the numbers. We take a single stock item, six weeks of real sales, and walk it through a weighted moving average, weeks of cover, and a reorder point — until it produces one concrete decision: order now, or wait. If you can do it for one SKU on paper, you can see exactly what a system should be doing for all of them automatically.
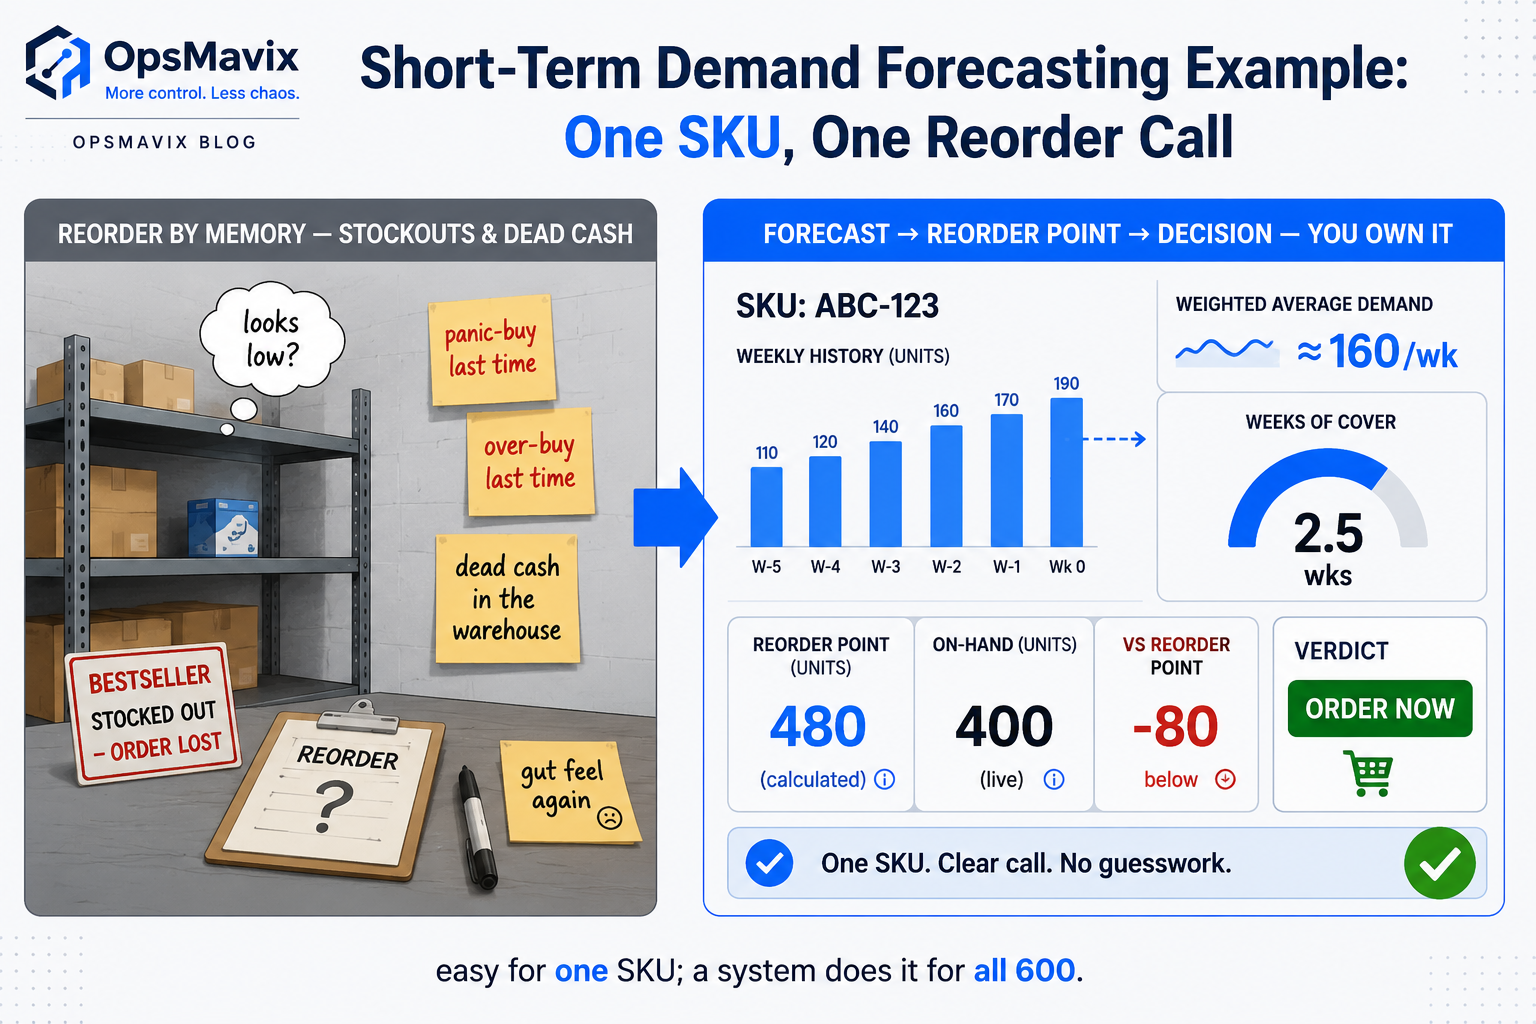
Here’s a short-term demand forecasting example in full, using one product and real numbers. A stock item sold 120, 140, 110, 160, 150 and 180 units over the last six weeks. A weighted moving average that leans on the recent weeks forecasts about 160 units for next week. The supplier takes two weeks to deliver, so you need roughly 320 units just to cover the wait — plus a buffer. With 400 units on the shelf, you’re under your reorder point, so the decision is: order now. That’s the whole loop — sales history in, a forecast out, a reorder decision at the end. This post walks every step so you can run it on your own bestseller today.
Short-term forecasting means the next few weeks to a quarter, not next year. It’s the horizon that actually drives purchasing: how much to order, and when, so you don’t oversell a line you can’t fulfil or bury cash in a product that isn’t moving. The methods below are deliberately simple — the kind you can do in a spreadsheet or on paper — because the point isn’t a clever model. It’s a decision you can trust.
Key Takeaways
- Short-term demand forecasting predicts the next few weeks of sales for a specific item, so you can decide how much to reorder and when.
- A weighted moving average — weighting recent weeks more heavily than older ones — is a solid, honest first method for most SKUs. No statistics degree required.
- Forecasts are per-SKU. A single business-wide number is useless for purchasing; you reorder items, not averages.
- The forecast is only half the job. You turn it into a decision using lead time, safety stock, and a reorder point — the numbers that say “order now” or “wait.”
- Doing it by hand for one product is easy. Doing it every week for hundreds of SKUs by hand is where the leak lives — that’s the part worth automating.
Step 1 of the Short-Term Demand Forecasting Example: Get Real Sales for One Item
Forecasting starts with actual demand, not gut feel. Pull the units sold per week for a single product — one of your bestsellers is the best place to learn, because the numbers are big enough to be meaningful. Say the last six weeks, oldest to newest, look like this:
| Week | 1 | 2 | 3 | 4 | 5 | 6 |
|---|---|---|---|---|---|---|
| Units sold | 120 | 140 | 110 | 160 | 150 | 180 |
Two things to check before you touch a formula. First, use demand, not just fulfilled sales — if you stocked out mid-week and turned customers away, the “sold” figure understates real demand and your forecast will inherit the blind spot. Second, strip out anything you know was a one-off: a bulk order from a single customer that won’t repeat, or a week distorted by a promotion. You want the underlying pattern, not the noise.
One inventory manager described the starting point honestly: their spreadsheet counts “wind up being off, sometimes wildly so.” If the history going in is wrong, the forecast coming out is theatre. Clean numbers first.
Step 2: Forecast With a Weighted Moving Average
A plain average of those six weeks is 143 units. But it treats week 1 (120 units, six weeks stale) as equally important as week 6 (180 units, last week). Demand is clearly trending up, and a plain average is slow to notice.
A weighted moving average fixes that by giving recent weeks more say. Take the most recent four weeks and weight them 4, 3, 2, 1 — newest gets the biggest weight:
- Week 6: 180 × 4 = 720
- Week 5: 150 × 3 = 450
- Week 4: 160 × 2 = 320
- Week 3: 110 × 1 = 110
Add those up: 1,600. Divide by the sum of the weights (4 + 3 + 2 + 1 = 10). The forecast for next week is 160 units.
That’s it — no software, no regression. The weighted average sits above the plain average (143) because it’s paying attention to the recent climb, but below last week’s spike (180) because it doesn’t overreact to a single big week. That balance is exactly what you want from a short-term forecast: responsive, but not twitchy. If your sales have a clear seasonal shape — a Black Friday run-up, a summer swing on garden lines — you’d layer a seasonal adjustment on top, but for a steady-selling item, the weighted moving average is enough to make a good buying call.
Step 3: Turn the Forecast Into Weeks of Cover
A forecast of 160 units a week is a number, not yet a decision. The bridge is weeks of cover: how long your current stock will last at the forecast rate.
You have 400 units on the shelf. At 160 a week:
Weeks of cover = 400 ÷ 160 = 2.5 weeks.
So without reordering, this product runs out in about two and a half weeks. Whether that’s fine or a fire depends entirely on one thing your forecast doesn’t know about: how long your supplier takes to restock you.
Step 4: Bring in Lead Time and Safety Stock
Say this supplier’s lead time is two weeks from order to shelf. That means the moment you place an order, you need enough stock to survive two weeks of selling before it lands:
Demand during lead time = 160 × 2 = 320 units.
If you held exactly 320 and demand ran perfectly to forecast, you’d hit zero the day the delivery arrived. Nobody’s demand is that polite. Some weeks sell 180, not 160. The supplier slips a few days. That’s what safety stock is for — a buffer that absorbs the variability so a normal bad week doesn’t become a stockout. A simple starting rule is one week of forecast demand as safety stock: 160 units. (For a tighter, variability-based number, see our safety stock calculation walkthrough — the principle here is deliberately kept simple.)
Step 5: Set the Reorder Point and Make the Call
Now you can build the trigger. The reorder point is the stock level at which you place a new order — set so that stock runs down to your safety buffer, not zero, exactly as the delivery arrives:
Reorder point = (forecast weekly demand × lead time) + safety stock Reorder point = (160 × 2) + 160 = 480 units.
Compare that to what’s on the shelf:
- On hand: 400 units
- Reorder point: 480 units
- 400 is below 480 → order now.
There’s the decision the whole exercise was for. You’re at 2.5 weeks of cover against a 2-week lead time with only half a week of slack — under the line. If you wait, a strong week or a slow supplier tips you into a stockout on a bestseller, which for a stock business means cancelled orders and customers who don’t come back. This is the mechanism behind a proper reorder point system: the forecast feeds the trigger, and the trigger removes the guesswork from when to buy.
How much to order is the same logic in reverse: pick a target level of cover, then order enough to close the gap — bounded by your cash, minimum order quantity, and shelf space. The point is that the forecast makes the number defensible instead of a shrug.
Why This Gets Hard (and Where the Leak Is)
Everything above took ten minutes for one product. Now do it for 600 SKUs, every week, each with its own sales pattern, lead time, and supplier quirks. That’s where the honest picture breaks down — not because the maths is hard, but because doing it by hand at scale is impossible, so most growing businesses quietly stop. They reorder on memory and panic instead: buy when a shelf looks empty, over-buy when a rep calls, and discover the stockout when a customer complains.
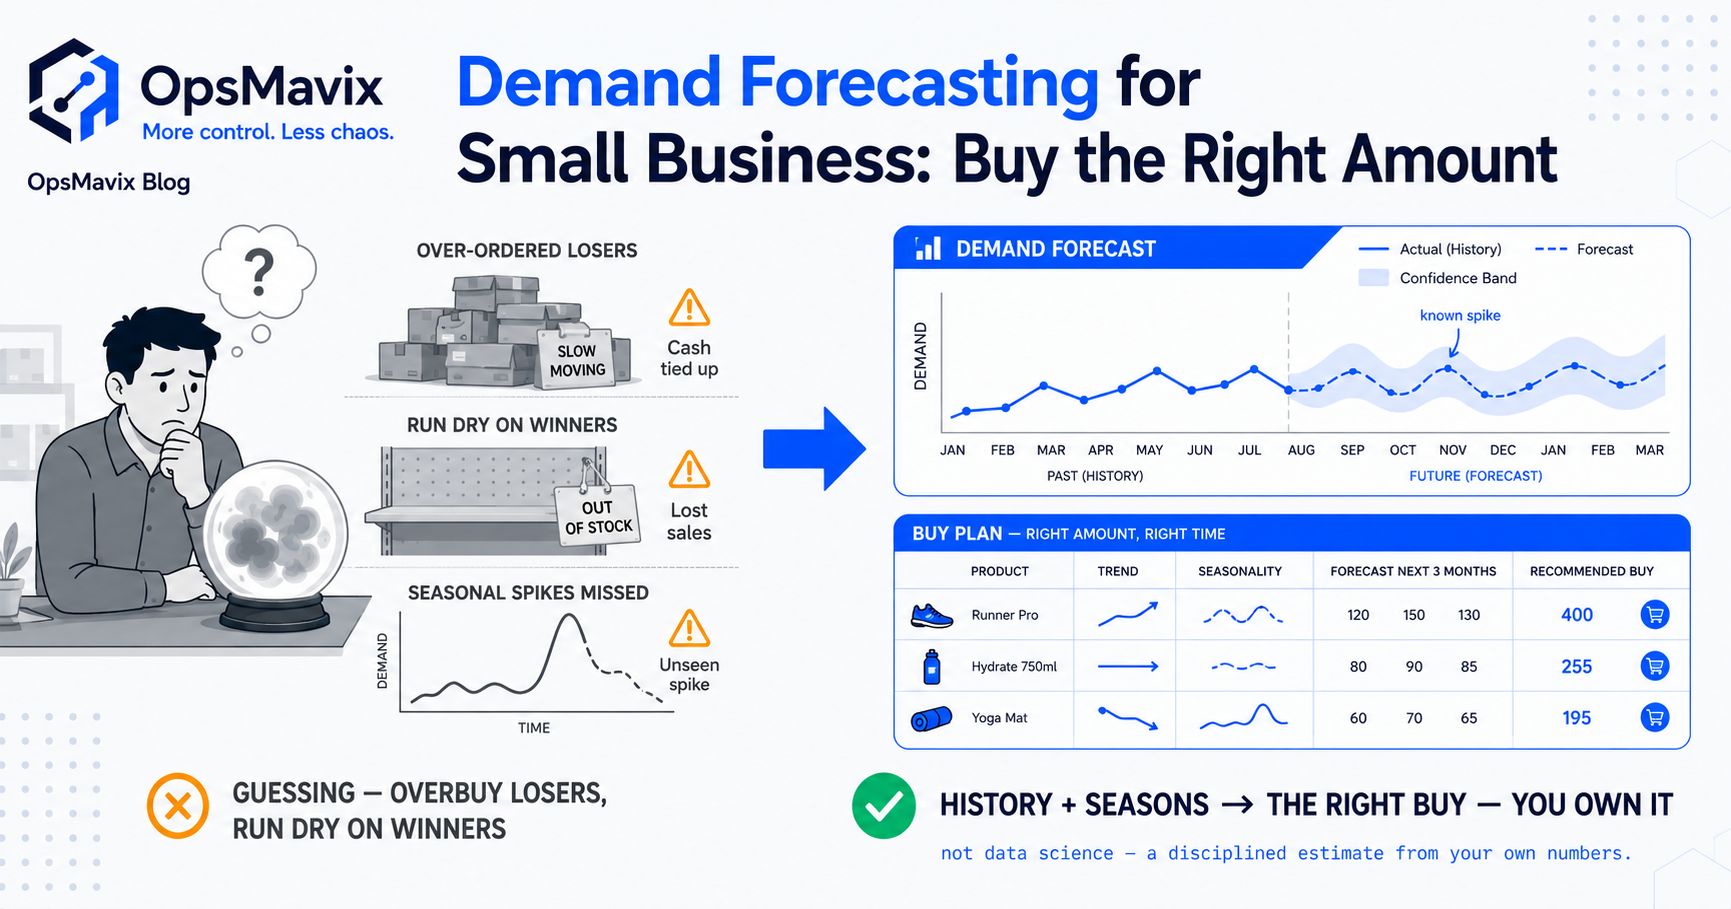
That’s the real leak short-term forecasting closes. A stock business that reorders by feel is carrying two costs at once — cash frozen in dead lines nobody’s counting, and lost sales on the bestsellers that quietly ran dry. Neither shows up on a single spreadsheet, which is exactly why it persists. The overview of demand forecasting for small businesses covers the strategic case; this worked example is the mechanic underneath it.
Our Take: Forecasting Is a Job for a System, Not a Spreadsheet Marathon
The contrarian bit: the answer to “we can’t forecast 600 SKUs by hand” is almost never “hire a planner to do it by hand faster.” It’s to build the loop above into a system that runs it automatically — pulls each SKU’s real demand, applies the weighted average, holds each supplier’s lead time, and flags only the items that crossed their reorder point this week. You go from forecasting nothing to reviewing a short list of exceptions. The maths never changes; it’s the same weighted average and reorder point you just did on paper. What changes is that a system does it for every product, every week, without anyone remembering to. That’s not an enterprise ERP with a forecasting module you’ll never fully configure — it’s a right-sized system that does the specific job your stock throws at you every week.
FAQ
What is a short-term demand forecast?
A short-term demand forecast predicts how much of a specific product you’ll sell over the next few weeks to a quarter — the horizon that drives purchasing. It’s built from recent sales history using a method like a weighted moving average, then turned into a reorder decision using lead time, safety stock, and a reorder point. Unlike long-range forecasting, it’s about the immediate “how much do I order and when” question, not annual planning.
What’s the simplest short-term forecasting method?
A weighted moving average is the simplest method that still respects a trend. You take the last few weeks of sales, weight the recent weeks more heavily than older ones, and average them. It’s more responsive than a plain average — it notices when demand is climbing or falling — but it needs no statistics background and works in a spreadsheet. For steady-selling items it’s usually all you need; seasonal lines need a seasonal adjustment layered on top.
How do you turn a forecast into a reorder decision?
Three numbers do it. Take the forecast weekly demand, multiply by your supplier’s lead time to get demand during lead time, then add safety stock to get your reorder point. When on-hand stock drops below the reorder point, you order. In the worked example, a 160-unit forecast, a two-week lead time, and one week of safety stock gave a reorder point of 480 — and with 400 on the shelf, the decision was to order now.
Do I forecast per product or for the whole business?
Per product. A single business-wide demand number is useless for purchasing because you order individual SKUs, each with its own sales pattern, supplier, and lead time. The bestseller trending up and the dead line trending down need opposite decisions, and an average hides both. The worked example above deliberately runs one SKU end to end for exactly this reason — the method is per-item, always.
How OpsMavix Can Help
OpsMavix builds right-sized inventory systems for stock businesses stuck in the gap — past what spreadsheets can hold, not looking for a full ERP. We build the part you actually run: real demand pulled per SKU, a forecast applied automatically, each supplier’s lead time and your safety-stock rules held in one place, and a weekly short list of exactly which items crossed their reorder point — the worked example above, running across your whole catalogue instead of one product at a time. It ties into your safety stock and reorder point logic so the forecast becomes a buying decision, not a report nobody reads. You own it outright: no per-SKU licence, nothing a vendor can switch off.
If you’re reordering on memory and finding out about stockouts from customers, start by seeing where it leaks. Book a Free Operations Leak Audit and we’ll map where your stock decisions cost you time and cash today, what it’s worth to close, and whether a right-sized forecasting system is the honest fit for how you buy now.
Keep reading
Getting value from OpsMavix? Add us as a preferred source on Google — you'll see more of our operations content in your AI Overviews, AI Mode and Search.