
Key Performance Indicators for Manufacturing: The Metrics That Matter
The key performance indicators for the manufacturing industry are only as good as the data behind them. This guide gives the formulas that matter and explains why the real leak is measurement itself, an owned tracking system fitting a factory outgrowing spreadsheets and disconnected tools.
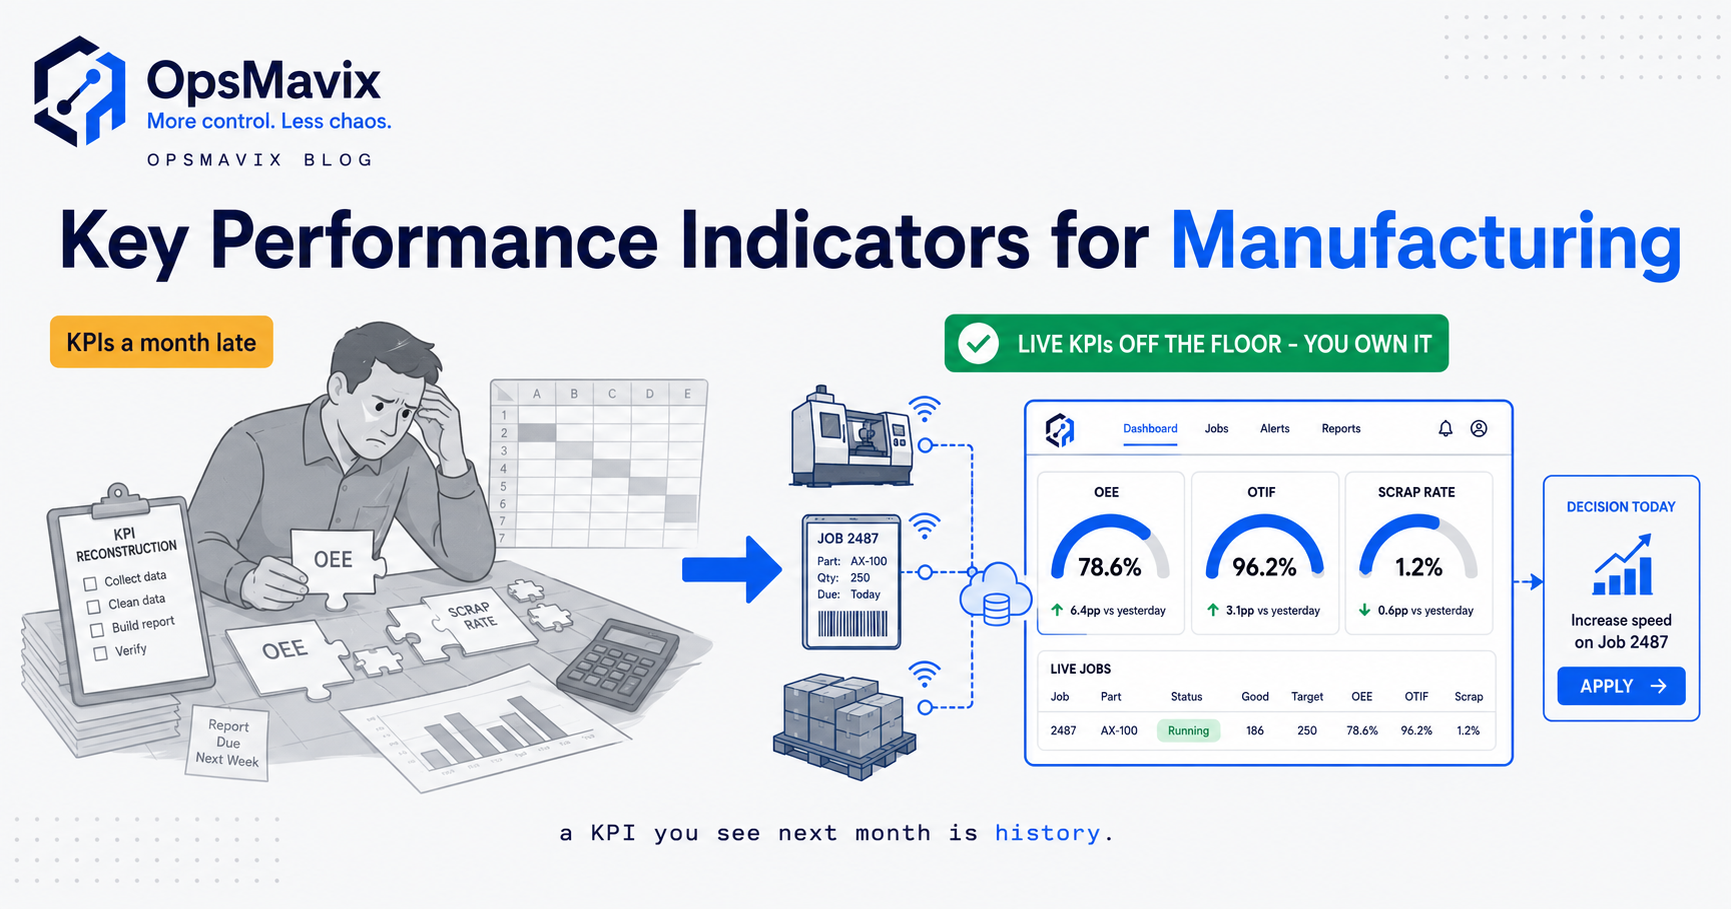
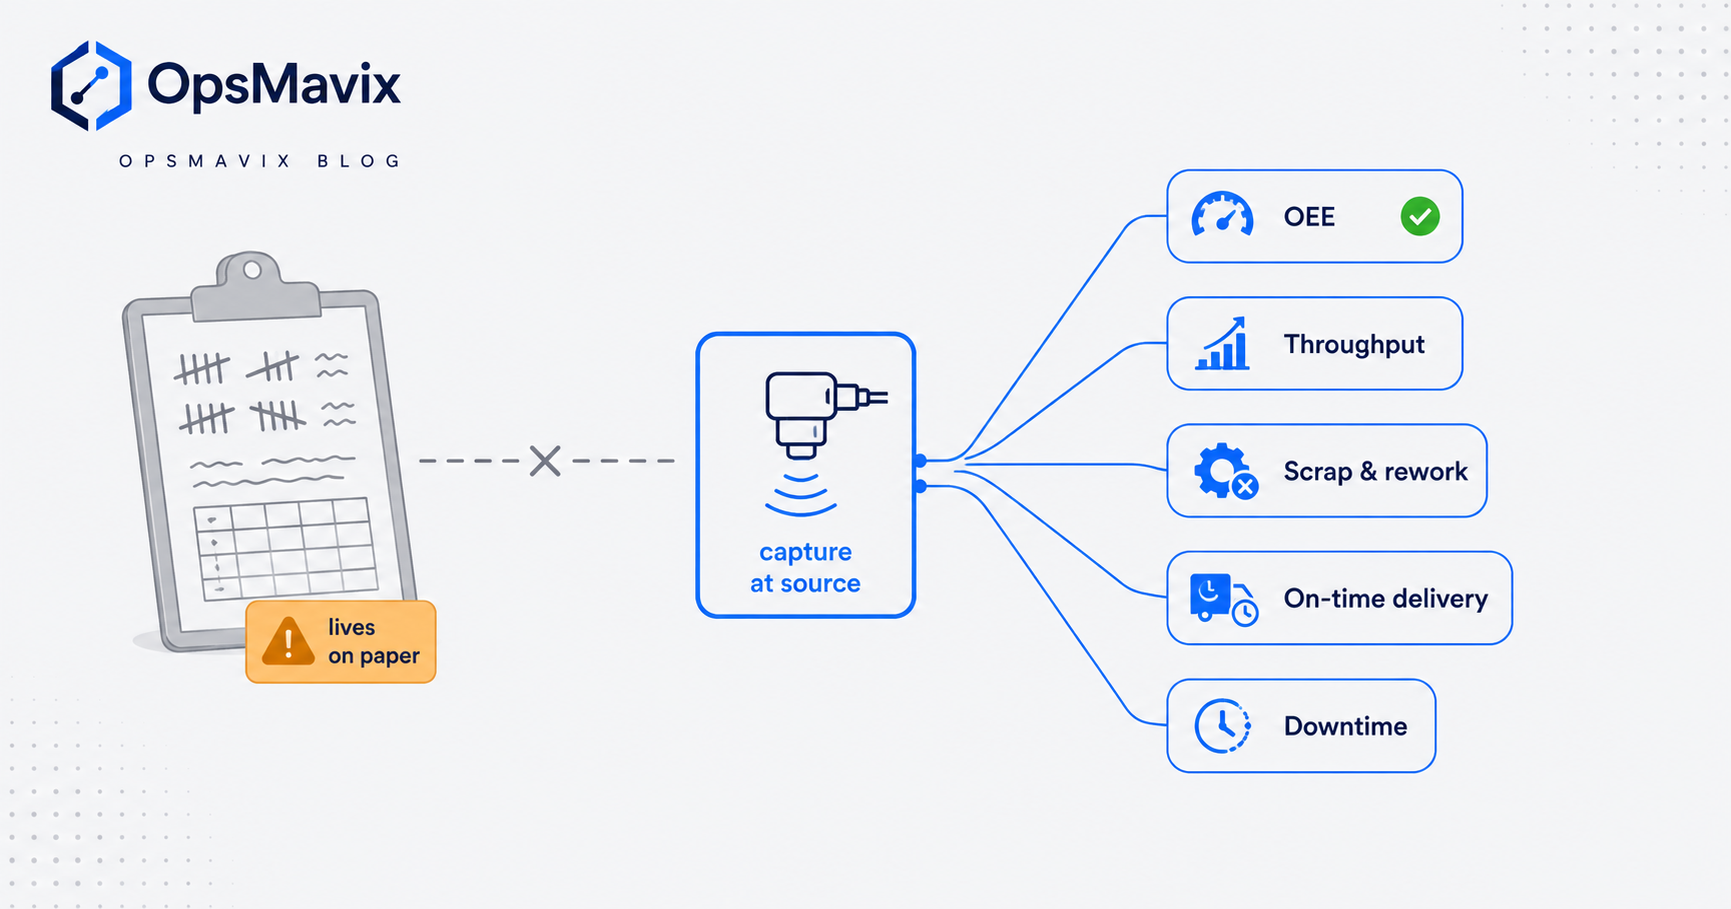
Key performance indicators for the manufacturing industry are the numbers that tell you whether your factory is actually working: how much good product it makes, how fast, how reliably, and at what waste. Overall equipment effectiveness, throughput, scrap and rework, on-time delivery, and downtime are the core five. Most lists you will find stop at naming them. The harder question is whether you can measure any of them without a person walking the floor with a clipboard.
That is the real pain, and you probably already feel it. You know roughly which machine is the bottleneck and which job always runs late, but you cannot prove it with a number, because the number lives in a supervisor’s head or on a paper tally that gets typed into a spreadsheet on Friday. A KPI you cannot measure cleanly is not a KPI. It is a guess with a percentage sign on it.
What manufacturing KPIs actually do
A KPI is not a report. A report tells you what happened. A key performance indicator is a single number, tracked over time, that you can act on this week. The distinction matters because most factories drown in data and starve for indicators. You can have a hundred fields in a job sheet and still not be able to answer the only three questions that decide whether the business grows: are we making enough, are we making it right, and are we delivering when we said we would.
Good manufacturing KPIs do three jobs at once. They expose where production is being lost, so you know which problem to fix first. They give you a baseline, so you can tell whether a change helped or just felt like it did. And they let you promise a customer a date and hold yourself to it. Anything that does none of those is a vanity metric, and vanity metrics are how factories end up measuring a lot and improving nothing.
You are comparing options, so you already know you need to track this. The question underneath the question is not which metrics to pick. It is how to get numbers you can trust without adding an hour of admin to every shift.
The five KPIs that actually drive a factory
These are the five that consistently move the business. Each has a plain formula. None of them needs a data scientist.
Overall equipment effectiveness (OEE). The single most useful production metric, because it folds the three main sources of loss into one score. The formula is Availability multiplied by Performance multiplied by Quality, each expressed as a percentage. Availability is run time divided by planned production time (it catches breakdowns and changeovers). Performance is actual output divided by what the machine could have produced at its ideal rate (it catches slow running and minor stops). Quality is good units divided by total units (it catches scrap and rework). According to Lean Production, 85 percent OEE is considered world class for discrete manufacturers, while 60 percent is fairly typical and manufacturers new to tracking often start around 40 percent. That gap is the point: a line running at 60 percent OEE is leaving roughly 40 percent of its planned capacity on the floor.
Throughput. How many good units you produce in a defined window, per hour, per shift, or per day. It is the metric your customers feel and your capacity planning depends on. Throughput answers “can we take this order without missing the ones we already have,” which is a question most shops answer by instinct and regret later.
Scrap and rework rate. Scrap rate is the proportion of units rejected outright. Rework rate is the proportion that need extra work to pass. Both are expressed as a percentage of total units. They matter because they connect the shop floor straight to margin: every scrapped part is material and machine time you paid for and cannot sell, and every reworked part is a promised delivery date quietly slipping. A factory that only tracks output and ignores scrap is measuring the top line of a leaking bucket.
On-time delivery (OTD) and on-time-in-full (OTIF). OTD is the percentage of orders delivered on or before the promised date. OTIF is the stricter version: on time and in the correct quantity. The formula is on-time-in-full deliveries divided by total deliveries. Per MRPeasy, a score of 95 to 99 percent is considered excellent across most industries, while anything below 85 percent points to real problems in scheduling or capacity. This is the KPI your customers grade you on whether you track it or not.
Downtime. The time equipment is not running when it was scheduled to. It feeds Availability inside OEE, but it deserves tracking in its own right because unplanned downtime is usually the biggest single lever on output, and it is almost always under-recorded. If nobody logs the reason a machine stopped, nobody can stop it happening again.
There are more (cycle time, first pass yield, capacity utilisation, energy per unit) but if you can measure these five reliably you can run a factory. Reliably is the operative word, and it is where most shops fall down. If you want the depth on the one metric that ties the others together, OEE monitoring is the place to start.
The real leak: metrics nobody can measure because the data lives on paper
Here is the uncomfortable truth about manufacturing KPIs. The formulas are easy. The measurement is where the money leaks. You cannot calculate OEE if downtime is logged as “machine playing up, an hour or so” on a paper sheet. You cannot trust your scrap rate if operators tally rejects on the back of a job card and half of them never get keyed in. You cannot report on-time delivery if the promised date lives in an email and the actual date lives in someone’s memory.
This is the black-box problem, and it is expensive at national scale. A report from FourJaw Manufacturing Analytics found that UK manufacturers could recover up to £129 billion in additional annual output by using production data they largely already generate, without major new equipment or headcount. The report’s own words: “The factory floor is still a black box for many organisations. Huge amounts of production data already exist, but without the tools to interpret it, manufacturers struggle to see where time and capacity are being lost.” The same research put the typical gain from best-practice production data at 16 percent more output for large manufacturers and around 30 percent for SMEs.
The capacity is already there. The machines are already running. What is missing is a clean, current record of what they are doing. When the data lives on paper, it arrives too late to act on (you find out about Tuesday’s downtime on Friday), it arrives wrong (manual tallies drift and get rounded), and it arrives contested, because the supervisor’s number and the office’s number never match. Meetings become arguments about whose figure is right instead of decisions about what to fix.
A KPI dashboard bolted on top of that mess does not fix it. It renders the same unreliable numbers in a nicer colour. The dashboard is the last mile. The first mile, capturing the event at the moment it happens on the floor, is the part that actually decides whether your metrics mean anything. Get the first mile wrong and every downstream chart lies to you confidently.
Off-the-shelf dashboard, full ERP, or owned tracking
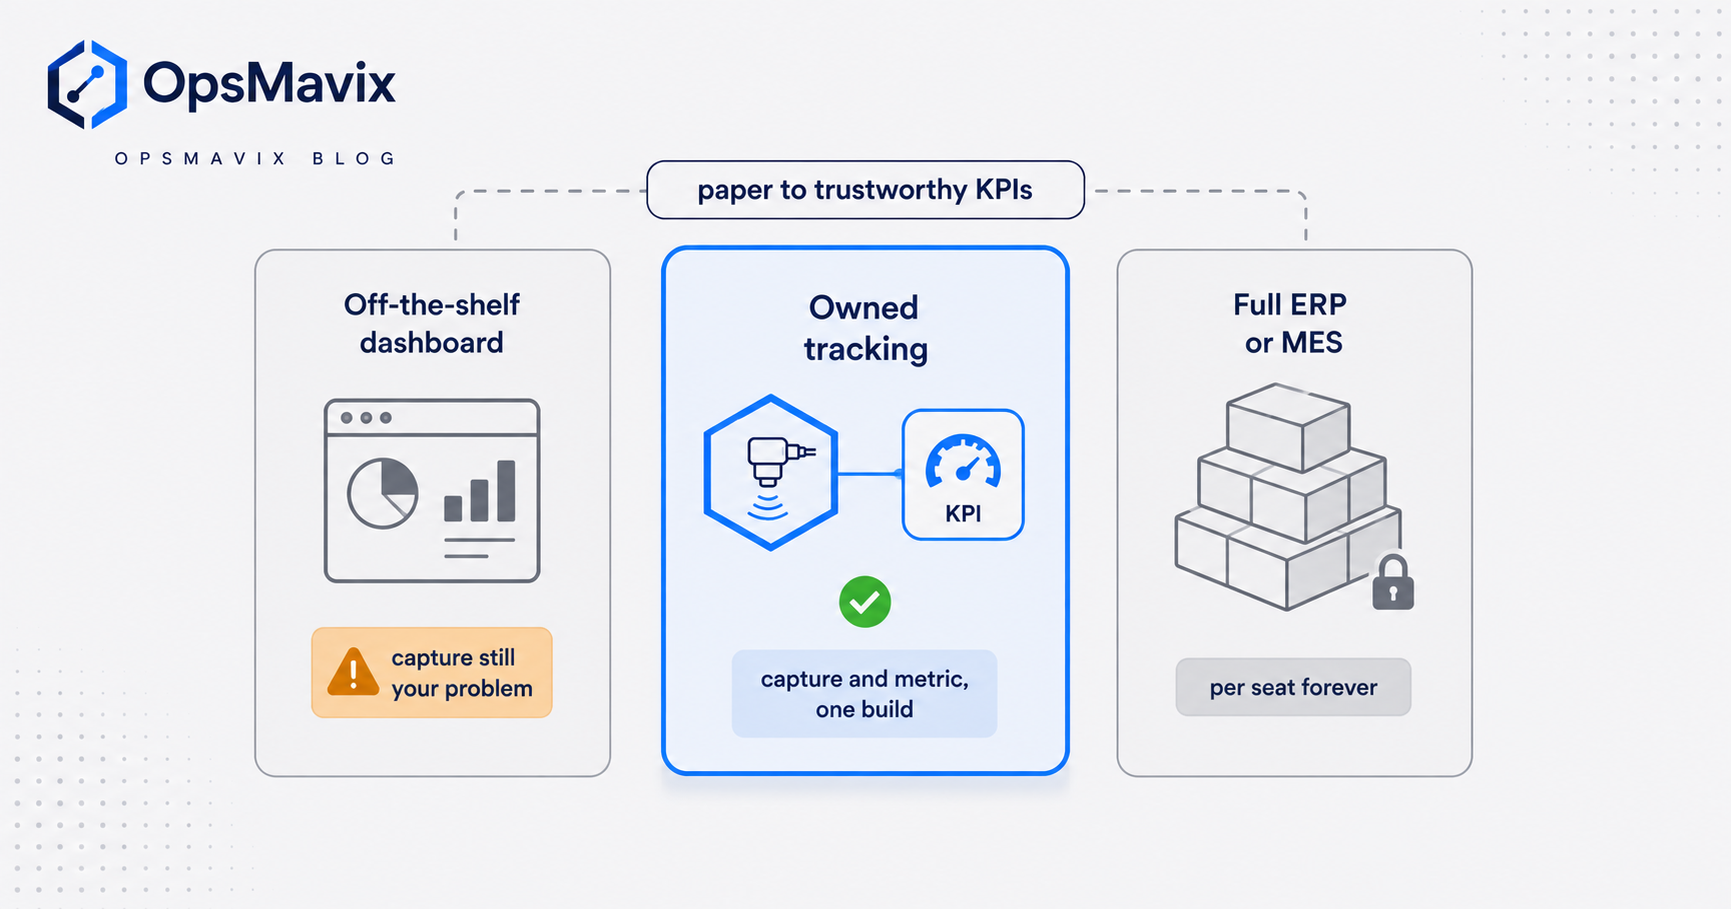
There are three honest ways to get from paper to trustworthy KPIs, and the right one depends on how your factory actually runs and how much the blind spot is costing you. Buy the cheapest one that closes your real gap.
| Off-the-shelf KPI dashboard | Full ERP or MES | Right-sized owned tracking | |
|---|---|---|---|
| What it is | A generic analytics tool you feed data into | A large system that runs the whole plant | Shop-floor capture and KPIs built around your process |
| Setup cost | Low subscription | High licence, long implementation | Moderate, built once |
| Ongoing cost | Per seat, forever | Per seat on everything, forever | You own it; hosting and support only |
| Where the data comes from | Still your problem to capture and feed in | Captured, if you work the ERP’s way | Captured at source, the way your floor works |
| Fits how you run | You format your data to suit it | You bend the plant to the system | The system fits the plant |
| Trust in the numbers | Only as good as what you pour in | High once fully configured and disciplined | High, because capture and metric are one build |
| Who owns it when it breaks | The vendor | The vendor and their partners | You do |
| Room to grow | Add more dashboards | Everything, at a price | Expand module by module, ERP-scale later |
| Best when | Your capture is already clean | You are large, complex, multi-site | You have outgrown spreadsheets but want to stay lean |
The off-the-shelf dashboard is genuinely fine if your capture is already solid, say you have machine sensors or a tidy MES already feeding it. If you are still on paper and spreadsheets, a dashboard just puts a screen in front of the same unreliable data. A full ERP or manufacturing execution system will capture and report everything, but you pay per seat forever, the implementation is long, and you reshape how the plant works to fit the software’s model rather than the reverse. Owned tracking sits in the middle: capture and KPIs are one system, built around the way your operators and jobs already move, you own the logic instead of renting it, and it can grow toward full ERP or MES scope later without a rebuild. For a shop that has outgrown spreadsheets but does not want the weight of an ERP, that middle path is usually the cheapest fix that actually produces numbers you can trust. It is the same logic behind a production monitoring system built around one plant’s reality rather than a template.
A worked example: the fab shop that could not prove its bottleneck
The following is illustrative, not a claim about a specific client.
Picture a UK metal fabrication shop turning over about £2.4m a year, running five CNC machines and a small welding cell across two shifts. Everyone “knows” the press brake is the bottleneck. Nobody can prove it. Downtime is logged on a clipboard per machine, scrap is tallied on job cards, and delivery dates live in the quoting inbox. Once a week a supervisor types a rough summary into a spreadsheet.
They decide to work out the press brake’s OEE properly for one week. Planned production time across two shifts is 80 hours. From the clipboards, actual run time comes to 52 hours, so Availability is 52 divided by 80, about 65 percent. At its ideal rate the brake should produce 6,400 parts in the run time it had; it actually made 4,800 good-or-bad parts, so Performance is 4,800 divided by 6,400, 75 percent. Of those, 4,300 passed first time and 500 were scrap or rework, so Quality is 4,300 divided by 4,800, about 90 percent. OEE is 0.65 times 0.75 times 0.90, which is roughly 44 percent. World class is 85 percent, typical is 60 percent. The brake is running well below even average.
Now the useful part. Because they finally have the breakdown, they can see the biggest loss is Availability, not Performance. The machine is not slow. It is standing still. Digging into the reason codes (which they only have because they started logging them), most of the lost time is changeover and waiting for material, not breakdowns. That is a scheduling and material-staging fix, not a new machine. They stage jobs differently, and Availability climbs from 65 to 80 percent over a quarter, lifting OEE from 44 to about 54 percent. On this line that is roughly 15 percent more good parts a week off equipment they already owned.
Put a number on the earlier blindness. For the months they assumed the brake was maxed out, they were quoting longer lead times than necessary and turning away or delaying work. Say that cost them two jobs a month at an average margin near £1,400 each. Over a quarter that is about £8,400 of margin lost to a bottleneck they could not measure, chased with a fix that cost them a change to a scheduling routine. The leak was never the press brake. It was that no clean number existed to argue with.
Integrations and why ownership matters
KPIs do not live in isolation. Your on-time delivery number needs to reconcile against what actually shipped, which touches your orders and dispatch. Your scrap number touches material cost, which touches accounting. Your throughput touches capacity planning, which touches quoting. So the question was never whether your KPI system integrates. It is who owns the joins.
With a rented dashboard plus a separate stock or accounting tool plus whatever glue connects them, you own none of the moving parts. When the dashboard vendor changes how it ingests data, or the connector to your accounts package breaks, a business-critical view goes dark and you wait for someone else to fix it. Worse, each tool captures events slightly differently, so the same job shows different quantities in different systems and nobody can say which is right. That is the black box, reassembled from paid subscriptions instead of paper.
Owned tracking inverts this. The capture layer, the event on the floor, is the single source, and every metric reads from it. When an operator logs a downtime reason, that one record feeds OEE, the downtime report, and the capacity plan at the same moment, so the numbers cannot disagree with each other. When a part is scrapped, the same event decrements good output, updates the scrap rate, and adjusts the delivery forecast. There is one record of what happened, and you own the rules that turn it into a KPI. That is what makes the number trustworthy: not a slicker chart, but one dataset that the floor, the office, and the customer promise all read from. Built this way, manufacturing production tracking turns reason codes, yields, and delivery dates into figures the system maintains on its own, rather than tallies a supervisor has to remember to key in.
FAQ
What are the most important KPIs for a manufacturing business?
For most factories the core five are OEE, throughput, scrap and rework rate, on-time delivery, and downtime. OEE is the most useful single number because it combines availability, performance, and quality into one score. Start with those, get them reliable, and add cycle time or first pass yield later if you need finer detail. More metrics on a bad data foundation is not progress.
What is a good OEE score?
For discrete manufacturers, 85 percent is considered world class, 60 percent is typical, and shops new to measuring often start around 40 percent. Do not chase 85 percent as a first target. If you are at 45 percent, the honest goal is to find out why and claw back the biggest loss, which is usually availability. The gap between your current score and 60 percent is normally where the cheapest capacity gains hide.
Do I need an ERP or MES to track manufacturing KPIs?
No. An ERP or MES will do it, but it is the heaviest and most expensive route, and you reshape the plant to fit the software. If your real problem is that the data lives on paper and you cannot trust your numbers, you can fix that with a lighter owned tracking system and scale toward ERP or MES scope later if you ever need it. Buy the cheapest thing that gives you numbers you trust.
Why can we not just use a spreadsheet for our KPIs?
You can, right up to the point where the shop grows past one person’s ability to keep it current. Spreadsheets fail on manufacturing KPIs for a specific reason: the data has to be typed in by hand after the fact, so it arrives late, drifts from reality, and gets contested in meetings. The maths is not the problem. The manual capture is. The moment two people maintain two versions, the KPI stops being a fact and becomes an argument.
How is OEE different from utilisation?
Utilisation usually just measures whether a machine is running against the clock. OEE is stricter because it also penalises slow running and defective output. A machine can look 90 percent utilised while producing at half its ideal rate with a 10 percent scrap rate, which is a much lower OEE. That is why OEE is the better indicator: it counts the losses that utilisation politely ignores.
How OpsMavix can help
OpsMavix builds right-sized operations systems for manufacturers that have outgrown spreadsheets and clipboards but do not want the weight and per-seat bill of a full ERP. If you cannot prove your bottleneck, trust your scrap rate, or report on-time delivery without a Friday reconciliation, the fix is not another dashboard on top of unreliable data. It is capturing the event on the floor once, at source, so OEE, throughput, scrap, downtime, and delivery all read from the same trustworthy record. You get numbers you can act on this week, the system fits how your plant already runs, you own it rather than renting a stack of tools and the glue between them, and it can grow toward full ERP or MES scope when you are ready. Start by finding the leak: Book a Free Operations Leak Audit.
Sources
- Lean Production, OEE (Overall Equipment Effectiveness). The OEE formula (Availability times Performance times Quality) and the benchmarks: 85 percent world class, 60 percent typical, 40 percent for those new to tracking.
- Plant & Works Engineering, on FourJaw’s Return on Information report. UK manufacturers could recover up to £129bn in additional output from data they already generate, with 16 percent output gains for large manufacturers and around 30 percent for SMEs, plus the “factory floor is still a black box” finding.
- MRPeasy, On-Time In-Full (OTIF) guide. The OTIF formula and the benchmark that 95 to 99 percent is excellent while below 85 percent signals real problems.
- Tractian, What Is World Class OEE?. The component targets behind an 85 percent world-class OEE: Availability 90 percent, Performance 95 percent, Quality 99.9 percent.
Keep reading
Getting value from OpsMavix? Add us as a preferred source on Google — you'll see more of our operations content in your AI Overviews, AI Mode and Search.