
Power BI for Small Business vs a Live Operations Dashboard
Power BI is a brilliant reporting tool, but it reports the past and only works once your data is already connected. Here's when Power BI for small business is the right fit, and when a live operations dashboard built around your actual ops does the job it can't.
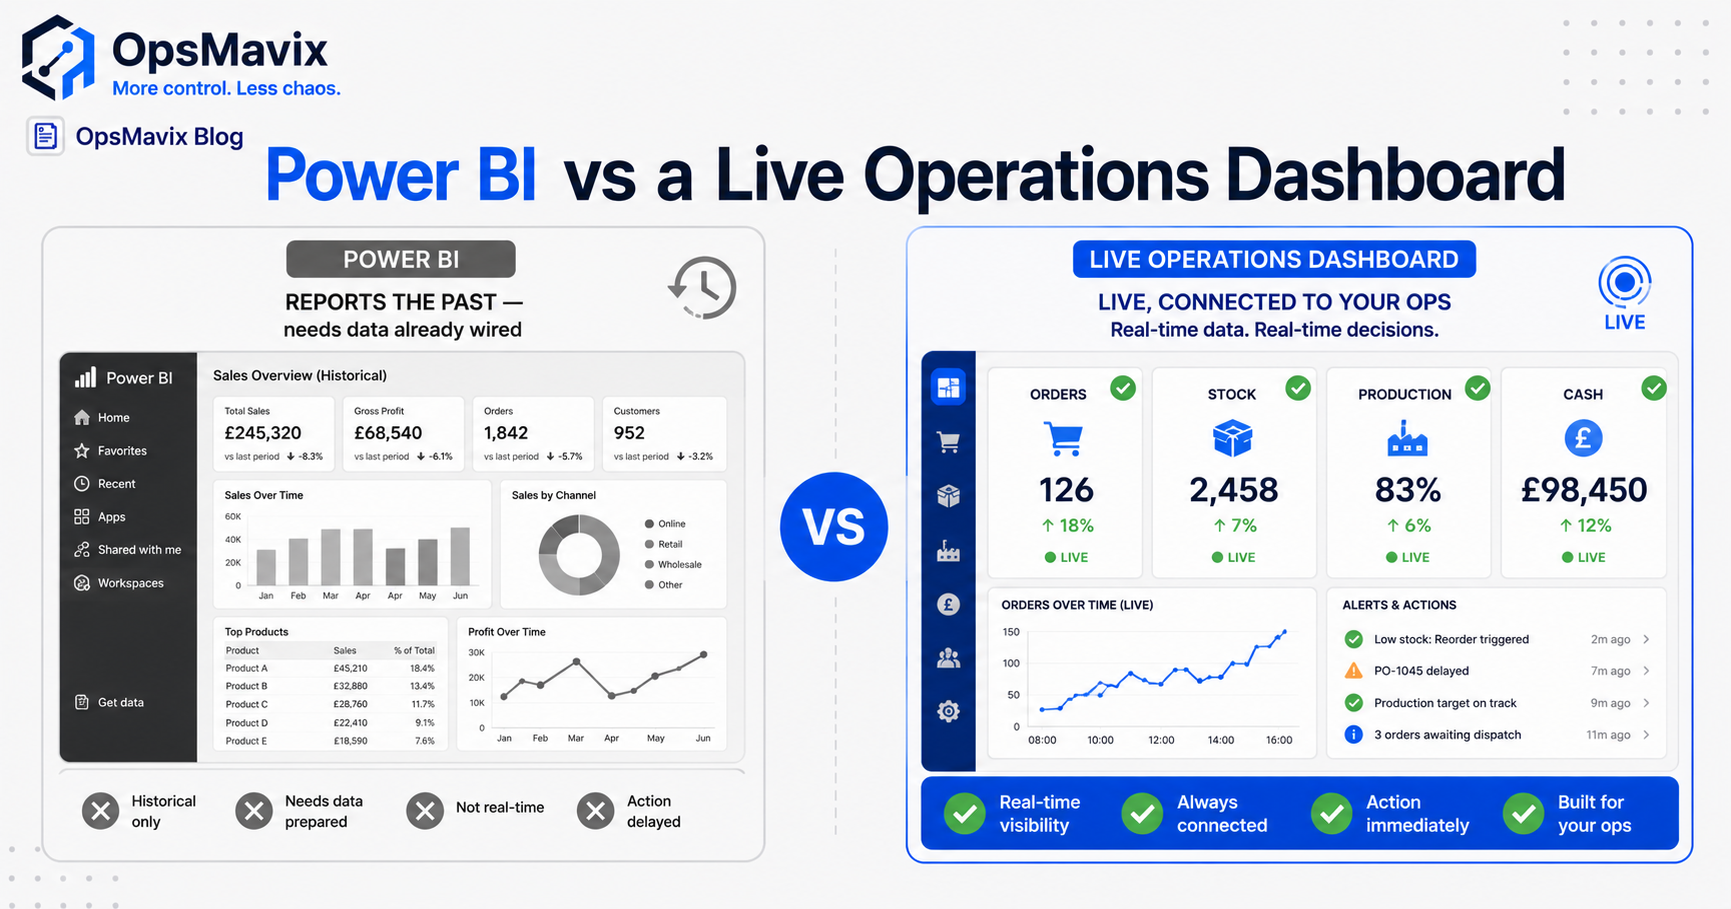
Power BI for small business is an excellent reporting tool, and a poor operations tool. It builds beautiful charts from data you’ve already gathered, but it reports the past and assumes your numbers are already connected and clean. If your real problem is that stock, orders, and jobs live in disconnected places and you’re stitching them together by hand, a live operations dashboard wired into your actual operations does the job Power BI can’t. This post covers when each one fits, fairly, so you buy the right thing.
Most people weighing up Power BI for small business have the same hope: one screen that finally tells them what’s going on. Power BI can show you a gorgeous version of that screen, refreshed on a schedule, drawn from whatever you feed it. The catch is the feeding. If your data is scattered across Xero, a spreadsheet, a warehouse tool, and someone’s inbox, Power BI doesn’t fix the scatter, it visualises it after you’ve connected it.
Key Takeaways
- Power BI is a business-intelligence and reporting tool. It analyses data you already have; it doesn’t run your operations.
- It reports the past on a refresh schedule. An operations dashboard reflects what’s happening now and is wired into the live workflow.
- Power BI assumes your data is already connected and clean. If it isn’t, you’ll spend your time building and fixing the pipeline, not reading the report.
- Power BI is the right call when your data is already in solid systems and you mainly need analysis and pretty board reporting.
- A custom operations dashboard is the right call when the mess is upstream: disconnected tools, manual re-keying, and a number nobody fully trusts.
1Power BI for Small Business Reports the Past. Operations Happen Now.
Power BI is a business-intelligence tool. Its job is to take data that already exists and turn it into charts, trends, and drill-downs, usually on a refresh schedule, hourly, nightly, whatever you configure. That’s genuinely useful for understanding what happened last quarter. It is not the same as knowing whether you can ship the order in front of you right now.
An operations dashboard answers the live question, not the historical one. Did the website just sell the last unit? Is that job still on the plan or has it quietly slipped? Has this invoice been approved or is it stuck? Those aren’t analytics questions, they’re operational ones, and they need a screen tied to the workflow as it moves, not a report assembled after the fact. The difference between an operations dashboard for a small business and a BI report is the difference between a live control panel and a rear-view mirror.
2The Hard Part Is the Data Pipeline, and Power BI Doesn’t Build It
Here’s the part the demo never shows. A Power BI dashboard is only as good as the connected, clean data behind it, and getting your data into that state is most of the work. If your stock lives in one tool, your orders in another, and your finance in Xero, someone has to connect all of that, reconcile it, and keep it reconciled. Power BI is the last 10% of that job. The first 90% is the pipeline.
Finance leads feel this acutely. One controller of a multi-entity group described her reality plainly: “consolidate via excel which is what we use at the moment.” Power BI wouldn’t end that. She’d still pull each entity’s trial balance and reconcile intercompany by hand, then point a chart at the result. The exhaustion she’s trying to kill, the manual stitching, is upstream of any reporting tool. As another finance team put it about their accounting software, “we shouldn’t have to be fiddling around creating excel reports.” A reporting layer on top of a manual pipeline just gives the manual pipeline nicer output.
3A Live Operations Dashboard Is Connected to Your Actual Ops
The distinction that matters: an operations dashboard isn’t pointed at your data, it’s part of how the data is created. When a sale happens, stock decrements in the same place the picker reads. When a job moves on the floor, the plan updates. When an invoice is approved, the status changes everywhere at once. The dashboard isn’t a report drawn from the systems, it’s the front of one connected system.
That’s why “live” actually means live, not “refreshed every hour.” There’s one figure for stock, one status for each order, one source for each number, and the screen shows the current state because it’s wired into the events that change it. Power BI can sit on top of a setup like that beautifully, for analysis. But the operational truth, the number you act on, comes from the connected system underneath, which is the thing you have to build first. If you’re not sure whether that’s what you need, start with what an operations system actually is.
4When Power BI Is Genuinely the Right Call
Be fair to the tool, because it’s a good one. If your data already lives in solid, connected systems, your finance is clean in one accounting platform, your sales sit in a proper CRM or ecommerce backend, your stock is accurate in one place, then your problem is analysis, not plumbing. That’s exactly Power BI’s home turf. It will give you trend analysis, slice-and-dice, and board-ready visuals far cheaper and faster than building something custom.
It’s also the right call if your need is genuinely reporting rather than operating: monthly performance reviews, finance analysis, marketing attribution, anything where looking at the past to make a decision is the whole job. And if your team already lives in Microsoft 365, the licensing and integration are easy. Don’t build a custom operations dashboard to do a job Power BI does well. That’s adding cost and complexity you don’t need, which is its own kind of leak.
5When Power BI Won’t Fix What’s Actually Broken
The trap is buying a reporting tool to solve an operations problem. If you’re overselling because channels don’t share a stock figure, Power BI charting the overselling won’t stop it. If month-end eats your first week because you consolidate by hand, a prettier board pack on the far end doesn’t shorten the close. If jobs fall off the plan and you only find out when a customer calls, a dashboard refreshed nightly tells you too late.
The same finance lead spends each period working to “manoeuvre bespoke spreadsheets to tailor reporting for Board members,” then lives with “the 3 AM panic when formulas break before a board meeting.” Power BI doesn’t touch either pain, because both come from the manual, disconnected layer beneath the report. When the leak is upstream, disconnected tools, re-keying, a number you’ve quietly stopped trusting, the fix is a connected operations system, with whatever dashboard you like on top, not a reporting tool pointed at the chaos. The honest test is the same one we apply to every tool: switch, or build, only when staying the same costs more than the fix.
Comparison Table
| Power BI (BI / reporting tool) | Live Operations Dashboard (custom) | |
|---|---|---|
| Primary job | Analyse and visualise data you already have | Run and show live operations as they happen |
| Time horizon | The past, on a refresh schedule | Now, the current state of stock/orders/jobs |
| Data assumption | Your data is already connected and clean | Built to connect the data; it’s part of the workflow |
| Fixes disconnected tools? | No, it visualises whatever you feed it | Yes, that’s the core of what it does |
| Stops overselling / dropped jobs? | No, it reports them after | Yes, one shared figure, live status |
| Best for | Finance analysis, board reporting, trends | Daily operating, ops control, one trusted number |
| Ownership | Microsoft licence, per-user fees | A system you own, built around your flow |
FAQ
Is Power BI good for small business?
Yes, for the right job. Power BI is strong, affordable business intelligence if your data already lives in connected, clean systems and you mainly need analysis, trends, and board-ready reporting. It’s the wrong tool if your real problem is that your operational data is scattered across disconnected tools and stitched together by hand, because Power BI reports data, it doesn’t connect or run your operations.
What’s the difference between Power BI and an operations dashboard?
Power BI is a reporting tool that visualises data you’ve already gathered, typically on a refresh schedule, so it shows the past. A live operations dashboard is part of a connected system that runs your operations, so it shows the current state, the stock you can sell right now, the job’s real status, whether an invoice is approved. One analyses; the other operates.
Can Power BI give me a real-time operations view?
Only as “real-time” as the connected data behind it, and only after that data is connected. Power BI doesn’t connect your tools or clean your numbers, you (or a consultant) build that pipeline first. If your stock, orders, and finance aren’t already in one connected system, the harder and more valuable work is building that system. The dashboard is the easy last step on top.
Do I need Power BI or a custom operations system?
If your data is already clean and connected and you need analysis and reporting, Power BI is likely the cheaper, faster answer. If the mess is upstream, disconnected tools, manual re-keying, overselling, jobs slipping off the plan, a number you’ve stopped trusting, then a custom operations system that connects the work is the real fix, with any reporting tool you like layered on top.
Will Power BI stop my spreadsheet chaos?
Usually not on its own. If you currently consolidate or reconcile in Excel by hand, Power BI will report the result, but you’ll still do the manual stitching every period. Ending the spreadsheet chaos means connecting the underlying systems so the data assembles itself. Once that’s done, you can point Power BI, or a built-in operations dashboard, at it.
How OpsMavix Can Help
OpsMavix builds custom operations dashboards that are wired into how your business actually runs, so stock, orders, jobs, and approvals update one live figure the moment the work happens, not a report assembled after the fact. We connect the disconnected tools first, because that’s the part Power BI assumes you’ve already solved. If you want Power BI for analysis on top of that, brilliant, you’ll finally have clean, connected data to point it at.
If your problem is the upstream mess, scattered systems, manual re-keying, a number nobody fully trusts, that’s exactly the middle ground we build, between drowning in spreadsheets and a six-figure ERP. Book an Operations Leak Audit and we’ll map where your data actually breaks down today, what the manual stitching is costing you, and whether you need a reporting tool, a connected operations system, or both.