
Basic Stock Control Spreadsheet: How to Build One That Doesn't Fall Apart
A basic stock control spreadsheet can run a small operation well if you build it right — the correct columns, a reorder point that does the thinking for you, and a movement log so the count nets itself. Here's the structure that holds up, then the honest signs you've outgrown it and what graduating to a right-sized system looks like.
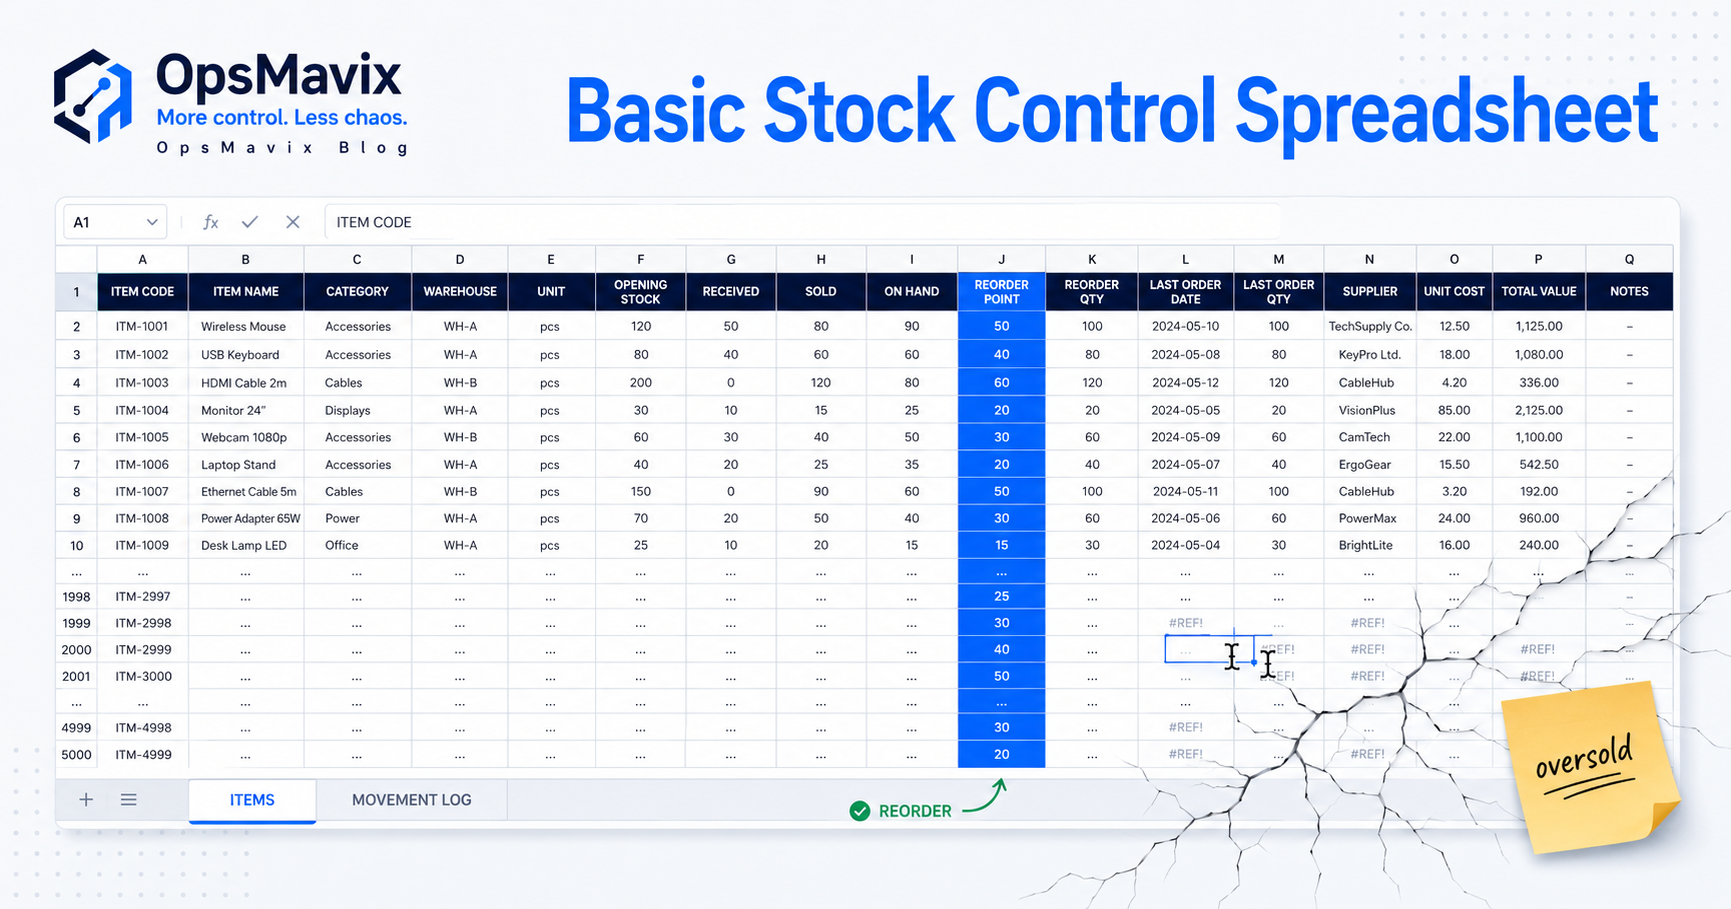
A basic stock control spreadsheet needs an item register, a movement log and calculated balances. Record receipts, issues, transfers and adjustments rather than overwriting a quantity cell. Add replenishment rules and physical checks, then assess whether the team can maintain the records reliably before buying more software.
The difficult part is keeping the spreadsheet aligned with actual work. A correct formula cannot include a delivery nobody entered, distinguish two products sharing one code or reserve stock against an order it never received. Good structure makes those problems visible; it does not remove the need for operational discipline.
This guide gives you a practical workbook design, a worked stock example and checks for deciding whether to improve the workbook, connect it to another tool or replace it. Shared spreadsheets can support multiple editors when configured correctly. Their suitability depends on the controls and workload, rather than a universal limit on product count.

Stock records should identify both the item and the place where it is held. Illustrative photograph, not an OpsMavix client.
Image credit: FIONASUN, CC0 1.0. Displayed at a reduced size; no additional edits.
Key Takeaways
- Keep stable item information separate from stock movements.
- Calculate balances from an agreed opening position and signed movements.
- Record stock units, locations and document references consistently.
- Separate physical stock, reservations, unavailable stock and incoming supply.
- Use reorder points as an explicit policy, with assumptions reviewed regularly.
- Test collaboration, reconciliation and recovery before deciding you need a new system.
In this guide:
- 1. Define What the Workbook Must Control
- 2. Build an Item Register and a Movement Log
- 3. Calculate Stock Without Overtyping the Result
- 4. Separate Availability from the Physical Count
- 5. Set Reorder Rules That Reflect Supply and Demand
- 6. Protect Entry, Collaboration and Recovery
- 7. Decide Whether to Improve, Integrate or Replace It
- 8. Pilot the Next Version Before Depending on It
- Frequently Asked Questions
- How OpsMavix Can Help
1. Define What the Workbook Must Control
Start with the decisions
Write down who uses the workbook and what they decide from it: whether to accept an order, replenish an item, move stock or investigate a difference. These decisions need different information. A purchasing report may include incoming supply; a picker needs stock in an eligible location now.
Agree when movements are entered. Logging a sale at invoice time may be too late for a business that reserves stock on order acceptance. Equally, deducting both the order and the dispatch as physical issues would count the same event twice.
Keep the initial scope manageable
Choose a product group and define the stock unit for each item. If you buy cartons and sell individual pieces, record the conversion instead of putting both quantities into one unlabelled column. A carton of 12 is not interchangeable with a carton of 24.
Decide whether you need locations, lots, serial numbers or expiry status. A simple workbook can contain these fields, but maintaining those relationships creates additional work. Test that work using representative transactions, rather than assuming the presence of a column establishes control.
| Decision | Required information | Common mistake |
|---|---|---|
| Can we fulfil this order? | Eligible stock less commitments | Treating all physical stock as free |
| Should we reorder? | Demand, lead time and supply already ordered | Ordering twice because the first PO is missing |
| Where can we pick it? | Item and location balance | Showing only a company-wide total |
| Why is the count different? | Movement history and physical check | Replacing the old number without a reason |
2. Build an Item Register and a Movement Log
Use one item code per distinct product
The item register should hold SKU, description, stock unit, supplier, lead time and replenishment policy. Treat descriptions as labels, not identifiers. Similar names and spelling differences should not create duplicate products.
Keep location balances in a separate summary if an item can exist in more than one place. A single location field in the item register cannot represent stock distributed across several bins.
Make each movement understandable
Suggested movement columns are:
- Unique movement reference.
- Effective date and entry date where these differ.
- Item code and location.
- Signed stock-unit quantity.
- Movement type, such as receipt, issue or adjustment.
- Related order, receipt or count reference.
- Person entering the movement and a useful reason.
A transfer should have an issue from the source and a receipt into the destination, connected by the same transfer reference. Do not treat the destination receipt as a supplier purchase.
Hypothetical transfer: move 10 units from A to B. Record minus 10 at A and plus 10 at B. The total held by the business remains unchanged. If goods travel between sites, an explicit in-transit location may be appropriate so neither site treats the goods as available prematurely.
3. Calculate Stock Without Overtyping the Result
Choose one opening-balance method
Either store an agreed opening quantity separately or enter it once as an opening movement. Do not use both methods together. The opening position needs a date, location and evidence of the physical baseline.
Microsoft documents SUMIFS for summing values that meet specified criteria. With an Excel table named Movements, columns SKU, Location and Qty, a summary whose item is in A2 and location in B2 can use:
=SUMIFS(Movements[Qty],Movements[SKU],A2,Movements[Location],B2)
This example assumes the opening quantity is already a movement. Names and separators must match your workbook and regional Excel settings. Test a known item before copying the formula across the summary.
Reconcile a known example
| Hypothetical movement | Signed quantity | Running balance |
|---|---|---|
| Opening position | 100 | 100 |
| Supplier receipt | 40 | 140 |
| Dispatch | -25 | 115 |
| Approved damage adjustment | -3 | 112 |
The expected balance is 112 units. A missing dispatch would incorrectly show 137. A duplicate receipt would show 152. The formula is still working in both cases; the input record is wrong.
Corrections should remain explainable. Use an agreed reversal or adjustment procedure with a reference to the original entry. A spreadsheet is not automatically an immutable audit trail simply because it has a movements tab.
4. Separate Availability from the Physical Count
Add reservations deliberately
On-hand stock describes what is recorded physically. Free stock also considers quantities already committed and stock that cannot be used. Keep these components visible instead of hiding them inside an unexplained final figure.
Hypothetical allocation: 112 units are on hand, 30 reserved for accepted orders and 7 held for inspection. Immediately free stock is 112 minus 30 minus 7, or 75 units. Incoming supply is not physically available yet.
A dated promise may take expected receipts into account, but their arrival and eligibility still need evaluation. If the workbook cannot reliably maintain order commitments, use it for purchasing or reporting rather than presenting it as a dependable real-time checkout balance.
Avoid duplicate deductions
When a reserved order ships, reduce physical stock and release its reservation. Otherwise you would deduct the same demand twice. A cancelled order releases the reservation without recording a physical dispatch.
Connect this rule to your wholesale order workflow if order acceptance, picking and invoicing happen in different tools. Define which event changes each balance and who checks failed updates.
5. Set Reorder Rules That Reflect Supply and Demand
Use a clear starting model
A basic reorder-point model is:
Reorder point = expected demand during replenishment lead time + safety stock
Hypothetical example: demand averages 12 units per working day, replenishment takes seven working days and the agreed buffer is 20 units. The trigger is 12 times 7 plus 20, or 104 units. Keep the demand and lead-time calendars consistent.
This simplified model assumes the averages are useful for the item. Seasonal demand, variable lead time, intermittent sales or large one-off orders may require another method. A buffer should be reviewed from actual uncertainty and the service requirement, rather than chosen once and forgotten.
Check existing supply before ordering
For purchasing, consider eligible on-hand stock, open supply and demand already committed under your chosen policy. The trigger quantity and order quantity are separate decisions. Supplier minimums, pack multiples, storage and cash also matter.
Record the purchase order as soon as it is agreed, with quantity and expected date. Review overdue supply. A red cell should lead to an assigned action, not automatically to another purchase order whenever someone opens the file.
6. Protect Entry, Collaboration and Recovery

Reliable balances depend on recording receipts and picks when the work happens. Illustrative photograph, not an OpsMavix client.
Image credit: Nenad Stojković / Shixart1985, CC BY 2.0. Displayed at a reduced size; no additional edits.
Support shared editing correctly
Excel supports co-authoring with supported applications and storage arrangements. Multiple editors are therefore not, by themselves, a reason to replace a spreadsheet.
Test your actual arrangement. Local emailed copies, unsupported versions and competing edits can still create problems. Agree one working location and make the authoritative copy easy to identify.
Protect calculation areas against accidental editing and use validated choices for item codes and movement types. These precautions reduce errors; they should not be represented as a complete security or audit-control system.
Maintain an exception routine
- Review negative balances and unknown item codes.
- Investigate duplicated document references.
- Check receipts and dispatches awaiting entry.
- Review unpaired transfers and overdue reservations.
- Compare selected items with physical counts.
- Keep a recoverable backup and test restoration.
Give each exception an owner. Do not remove a warning merely because it makes the report look untidy. Investigating it is part of operating the workbook.
7. Decide Whether to Improve, Integrate or Replace It
Assess the actual constraint
A workbook can calculate several locations and commitments. The buying question is whether your team can maintain those records promptly, control changes and explain discrepancies at an acceptable cost.
| Route | Suitable circumstance | Evidence needed |
|---|---|---|
| Improve the workbook | Entry workload is manageable and failures are structural | Known calculations, controls and recovery work |
| Connect a form or existing tool | Re-keying is the main problem | Reliable event capture and duplicate handling |
| Packaged inventory software | Standard purchasing, stock and picking suit the operation | End-to-end workflow demonstration |
| Focused custom system | A valuable workflow gap remains | Defined scope, support and integration tests |
| Full ERP | Wider finance and operational processes need coordination | Business case and implementation capacity |
Avoid assuming that custom always costs less or that a packaged tool must force an unsuitable process. Test configuration first and compare implementation, ongoing support and remaining manual effort.
Quantify administration carefully
Hypothetical capacity example: four weekly hours of reconciliation valued at £25 an hour over 48 weeks represent £4,800 of annual staff capacity. That is not an automatic cash saving. Software only creates value if it removes the relevant work without adding equivalent administration elsewhere.
8. Pilot the Next Version Before Depending on It
Use an acceptance checklist
Pick one product group and exercise receipt, dispatch, cancellation, transfer, return and stock-count correction. Include an incorrect code, duplicate entry and a missed movement.
Before extending the scope, verify that:
- Opening quantities match an agreed baseline.
- Every physical movement has one appropriate record.
- Transfers preserve the total quantity where no loss occurred.
- Reservations are released correctly on shipment or cancellation.
- Formula ranges include newly added rows.
- The person using the report understands its timing.
- A physical discrepancy can be investigated and corrected.
- Another team member can restore and operate the workbook.
Plan the cutover if changing systems
Freeze entries at an agreed point, reconcile open orders and supply, and record the final opening position in the new tool. Keep historical references accessible. Define how the team handles work during the change and where it records exceptions.
An improved spreadsheet and a new application both require ownership. Decide who maintains item data, reviews replenishment inputs and checks the daily exceptions. A reliable inventory system supports that routine rather than replacing responsibility for it.
Frequently Asked Questions
What should a basic stock control spreadsheet contain?
Use an item register, a movement log and calculated summaries. Include unique item codes, stock units, locations, signed quantities and references so balances can be explained.
Should I type the on-hand quantity manually?
Prefer an agreed opening balance plus recorded movements. Correct errors through an explainable adjustment procedure instead of silently replacing the result.
Can Excel calculate stock for multiple locations?
Yes. A movement table and location criteria can calculate separate balances. The practical limit is whether the team records and reconciles those movements reliably.
Can several people use the workbook at once?
Supported Excel co-authoring arrangements allow shared editing. Test application versions, storage, permissions and conflicting changes before depending on the setup operationally.
How do I calculate a reorder point?
A simple starting model is expected demand during lead time plus safety stock. Use consistent time units and review demand variability, supplier performance and the buffer policy.
Is incoming stock available to sell?
It is not physically available before receipt. A future customer promise may consider expected supply, but needs arrival dates, existing commitments and a clear policy for uncertainty.
Does a movement log guarantee accurate stock?
No. Missing, duplicate or incorrect entries still create inaccurate balances. Physical checks, exception review and timely entry remain necessary.
When should I replace the spreadsheet?
When the observed workload or control gaps cannot be resolved economically through improvements or integration. Test packaged software and focused custom options against the same real transactions.
Can OpsMavix build a full ERP as well as stock control?
Yes. The scope may be a focused inventory application, an integration or a full custom ERP where broader processes justify it. The choice should follow demonstrated requirements.
How OpsMavix Can Help
OpsMavix can assess your workbook, stock movements and order commitments before recommending a change. We compare practical spreadsheet improvements, configuration of existing software, integration and custom development.
Our inventory automation work can connect receipts, stock movements and exceptions to the tools your team uses. Where orders are the missing link, we can join them to wholesale order management. A focused system or full ERP can be built when the wider requirements support it.
Contact OpsMavix with one item whose physical count and workbook balance disagree, the movement records and the decisions that depend on it. We can map the cause and establish a limited, testable next step.
Keep reading
Getting value from OpsMavix? Add us as a preferred source on Google — you'll see more of our operations content in your AI Overviews, AI Mode and Search.