
Ops Dashboard for Growing Businesses
An ops dashboard helps growing businesses see orders, stock, tasks, reports, and daily operations in one clear view.
An ops dashboard gives a growing business one clear place to see what is happening across daily operations.
At the beginning, business updates are easy to manage. The team is small, orders are limited, and the owner can still follow most details directly.
But as the business grows, information starts spreading across spreadsheets, emails, messages, and different tools. Orders, stock, tasks, reports, and customer updates no longer live in one clear place.
That is when an ops dashboard becomes useful. It gives owners and managers a faster way to see what needs attention, what is delayed, and where the business is losing control.
1An Ops Dashboard Solves the Visibility Problem
Many operations problems start with poor visibility.
The business may be busy, but management cannot easily see what is happening without asking the team, checking spreadsheets, or waiting for reports.
Common visibility problems include:
- Orders are delayed but not easy to spot
- Stock levels are unclear
- Tasks are overdue
- Approvals are stuck
- Reports take too long to prepare
- Customer updates are missed
- Teams are working from different information
An ops dashboard brings key information into one place so the business can see what needs attention faster.
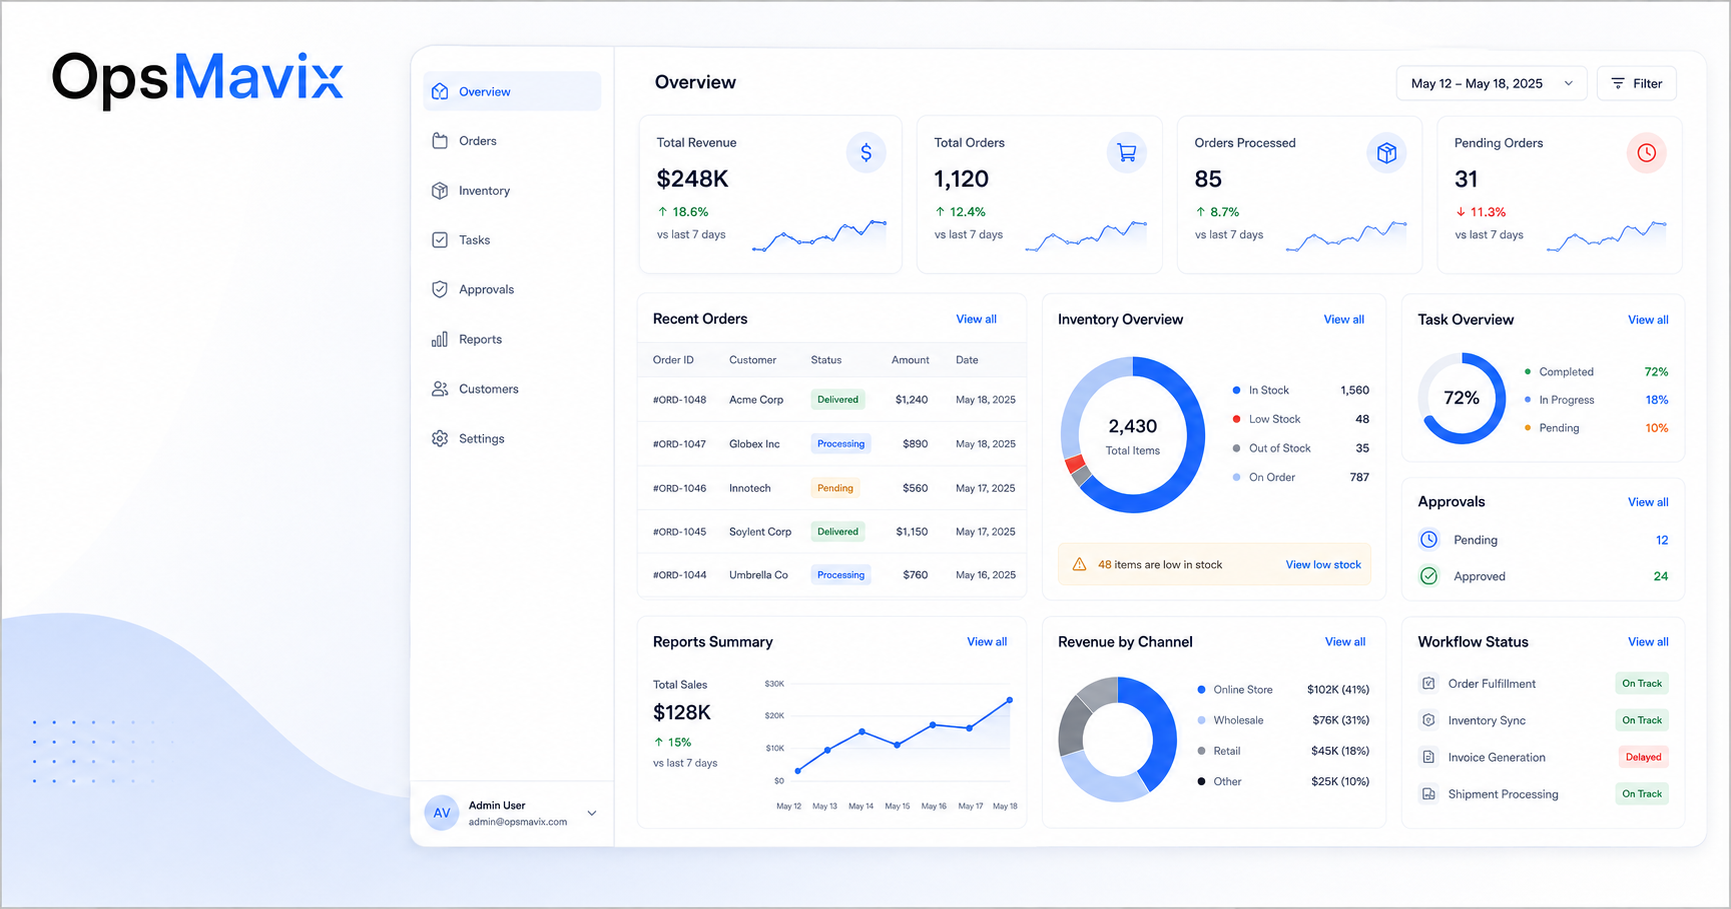
2What an Ops Dashboard Should Show
A good ops dashboard should not show random charts. It should show the information that helps the business make better decisions.
Useful dashboard areas may include:
- Open orders
- Delayed orders
- Stock warnings
- Task status
- Workload by team
- Approval status
- Customer updates
- Project progress
- Revenue or margin snapshots
- Operational alerts
The dashboard should be simple enough to understand quickly. If it becomes too crowded, people stop using it.
A project operations dashboard can help bring tasks, project status, deadlines, and reporting into one clearer view.
3Why Spreadsheets Are Not Enough
Many businesses try to build reports manually from spreadsheets.
This works for a while, but it becomes harder as the business grows.
Common spreadsheet reporting problems include:
- Data is copied from different files
- Reports depend on one person
- Numbers are not always trusted
- Updates are delayed
- Mistakes are hard to find
- The report is outdated by the time it is shared
An ops dashboard should reduce this manual work. Instead of rebuilding the same report every week, the business can use connected data and live views.
For businesses with stock complexity, an inventory automation system can help make stock data easier to trust inside the dashboard.
4The Dashboard Should Match the Workflow
An ops dashboard is only useful if it reflects how the business actually works.
Before building one, the business should understand the workflow behind the data.
Ask:
- Where does the process start?
- What steps should be tracked?
- Who owns each step?
- What information changes daily?
- Which delays matter most?
- Which reports does management need?
- Which alerts should be visible?
This helps avoid building a dashboard that looks good but does not help the team.
For order-heavy businesses, a wholesale order management system can help connect order flow, statuses, and reporting more clearly.
5When Your Business Needs an Ops Dashboard
Your business may need an ops dashboard when it becomes difficult to answer basic operational questions quickly.
For example:
- Which orders are late?
- Which tasks are blocked?
- Which products are running low?
- Which approvals are waiting?
- Which customers need updates?
- Which team is overloaded?
- Which reports are out of date?
If these questions require several messages, spreadsheets, or manual checks, the business needs better visibility.
An ops dashboard helps turn scattered updates into one clearer operational view.
What To Do Next
Start by choosing the most important area to track.
Do not try to build a dashboard for everything on day one. Begin with the process that creates the most confusion.
This could be:
- Orders
- Stock
- Tasks
- Projects
- Approvals
- Customer updates
- Reporting
Then decide which numbers, statuses, and alerts are most important.
The goal is not to make the dashboard look impressive. The goal is to make the business easier to manage.
How OpsMavix Can Help
OpsMavix helps growing businesses build practical ops dashboards, workflows, and internal operations systems.
We work with companies that are outgrowing spreadsheets, manual reports, and disconnected tools.
OpsMavix can help you:
- Map your current operations
- Identify the right dashboard metrics
- Connect key business data
- Build clear reporting views
- Track orders, stock, tasks, and approvals
- Reduce manual reporting
- Improve management visibility
- Create dashboards that support real decisions
If your team is spending too much time checking updates and building reports manually, OpsMavix can help you build a clearer ops dashboard.