What a Real Operations Dashboard Should Show You
Eight spreadsheet tabs and a gut feeling isn't a dashboard. Here's the handful of live numbers a real operations dashboard should show — and how to get one.
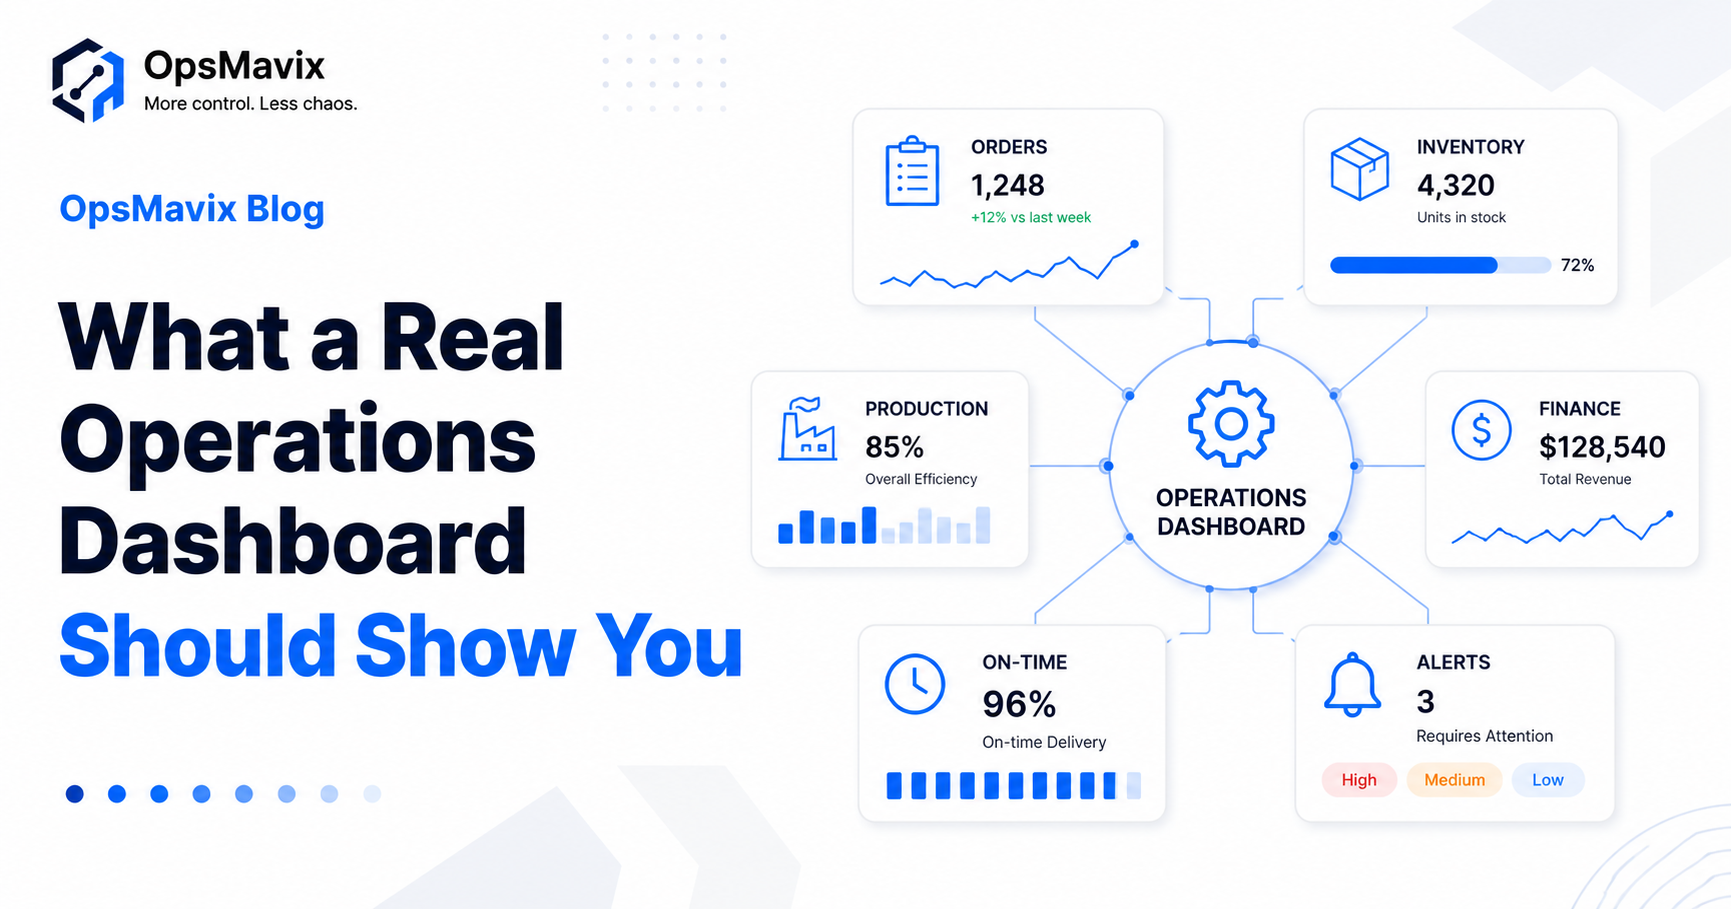
A real operations dashboard for a small business shows you, at a glance, whether today is on track — the handful of live numbers across orders, stock, production and finance that tell you where the business actually stands right now. Not forty metrics. The few that change a decision.
Most small businesses don’t have that. They have eight spreadsheet tabs, three logins, and a gut feeling. The data exists — it’s just scattered, stale, and impossible to see together. So problems get spotted late, after they’ve already cost something.
Here’s what an operations dashboard should actually show you, what to leave off, and how to get one without hiring a data team or buying heavyweight BI software.
Key Takeaways
- A dashboard’s job is one live view of whether today is on track — orders, stock, production, finance.
- Show the few numbers that change a decision, not every metric you can measure.
- Real-time beats end-of-month — you fix problems while you still can.
- You don’t need a BI team; a custom dashboard built on the tools you already use does it.
- If you check multiple spreadsheets to answer “how are we doing?”, you’ve outgrown them.
1What an Operations Dashboard for a Small Business Actually Is
An operations dashboard is a single screen that answers one question — is the business on track today? — using live data pulled from the systems you already run. It’s not a report you build at month-end; it’s a standing view that updates itself.
The distinction matters. A report tells you what happened. A dashboard tells you what’s happening, while you can still act on it.
2The Numbers Worth Putting On It
Put on the few metrics that would change what you do today. For most operations-led businesses that’s a small set across four areas:
- Orders — open orders, anything overdue, what’s due to ship today.
- Stock — items below reorder level, value on hand, anything out of sync.
- Production / delivery — jobs in progress, what’s late, on-time rate.
- Finance — cash position, invoices awaiting approval or payment.
Leave off vanity metrics and anything you’d never act on. A crowded dashboard is just a prettier spreadsheet. If a number doesn’t trigger a decision, it doesn’t earn a place.
3Real-Time Beats End-of-Month
The value of a dashboard is timing: it surfaces a problem while you can still fix it. A stockout flagged this morning is a quick call to the supplier; the same stockout found at month-end is a lost sale, an angry customer and a rush-shipping bill to paper over the gap.
End-of-month reporting tells you about problems you can no longer prevent. A live operations dashboard moves that moment forward — from autopsy to early warning.
4Spreadsheets vs a Live Dashboard
| Spreadsheets / multiple tabs | Live operations dashboard | |
|---|---|---|
| Freshness | As old as the last manual update | Updates from your systems automatically |
| Scope | One area per file | Orders, stock, production, finance together |
| Answering “how are we doing?” | Open several tabs, reconcile | One screen |
| Problem detection | At month-end | As it happens |
| Who can read it | Whoever knows the spreadsheet | Anyone on the team |
5How to Build One Without a BI Team
You don’t need data analysts or enterprise BI software. The practical route is to connect the tools you already use — your orders, stock, accounting and production data — into one view built around the questions you actually ask.
Start narrow: pick the five numbers you check most often and get those live first. A focused dashboard built on your real workflow beats a generic BI tool you have to bend your business around. The same data can later feed your inventory system and invoice approvals, so everything draws from one source — the dashboard is one of the operational systems every growing business needs.
FAQ
What should an operations dashboard show?
The few live numbers that tell you whether today is on track — typically open and overdue orders, low stock, jobs in progress and what’s late, plus cash and pending invoices. Show what drives decisions, not everything you can measure.
How do I build one without a BI team or analyst?
Connect the tools you already run into one view rather than buying generic BI software. A custom dashboard built around your real workflow is simpler to adopt and doesn’t need a dedicated data team to maintain.
What KPIs should a small business track?
Start with the handful you already check manually — on-time delivery, overdue orders, stock below reorder level, cash position, invoices awaiting approval. Add more only when a metric would genuinely change a decision.
Can I build it from Excel or Google Sheets — and when do I outgrow that?
You can start there, but you outgrow it the moment the data is too big or too live for one person to keep current, or when several people need the same up-to-date view at once. That’s when a connected dashboard pays off.
How do I get orders, stock, production and finance into one view?
By linking those systems so they feed a single dashboard instead of living in separate files. The work is in connecting your existing tools cleanly — which is exactly what a custom operations system does.
How OpsMavix Can Help
OpsMavix builds custom operations dashboards for growing businesses — one live view of orders, stock, production and finance, built on the tools you already use, no BI team required.
If you’re answering “how are we doing?” by opening eight spreadsheets, that’s an operational leak worth closing. Book an Operations Leak Audit and we’ll map the few numbers your business should be watching live.