
Inventory Management Dashboard: What It Should Actually Show (and the Leaks It Closes)
An inventory management dashboard is only worth having if every number on it matches the shelf. Here's what one should actually show, the leaks it closes (overselling, phantom stock, dead lines), when to buy off-the-shelf versus build, and how to right-size it without buying a £100k WMS.
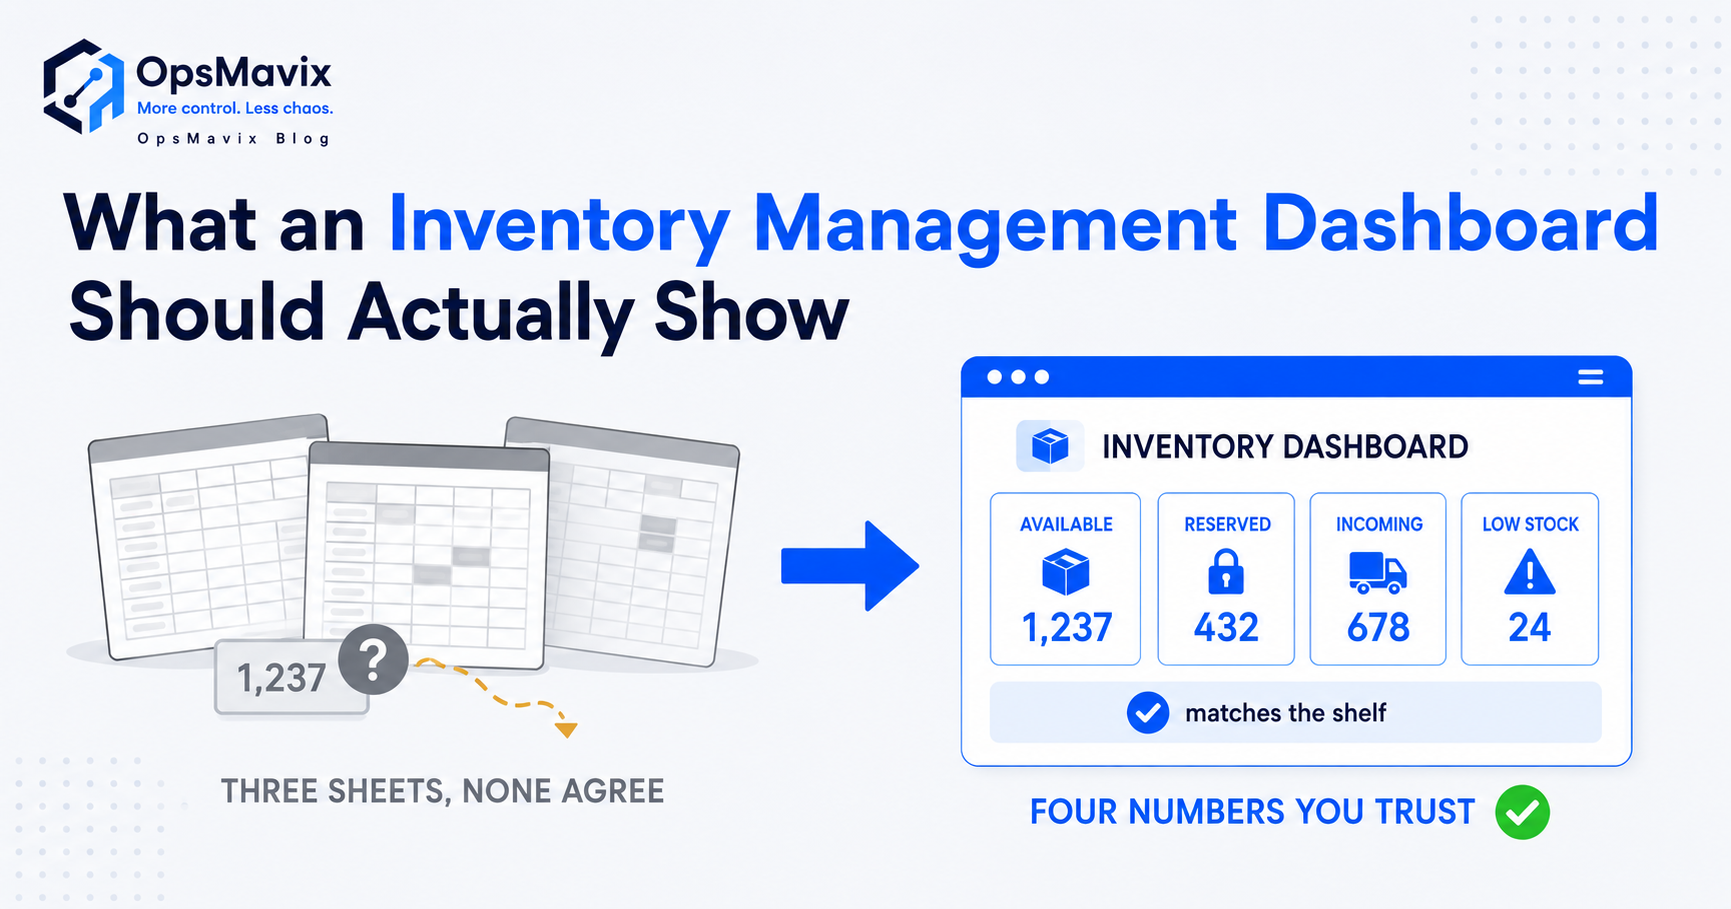
An inventory management dashboard is a single live screen that shows what you actually have, where it is, and what’s about to go wrong with it — stock on hand, what’s allocated to open orders, what’s running low, and what hasn’t moved in months. That’s the short answer. The longer one is that most “dashboards” sold under that name show numbers that don’t match the shelf, which makes them worse than useless: they give you confidence in a figure that’s lying. A dashboard is only worth the screen it’s on if every number on it is true, and the whole point is to catch the leak — the oversell, the phantom count, the dead line — while you can still do something about it.
This post covers what an inventory management dashboard should genuinely show, the specific leaks a real one closes, where the data has to come from for the numbers to hold, and the honest build-versus-buy call for an SME. If you want the wider operations view across orders, production and finance, that lives in the operations dashboard for small business guide — this one stays on stock.
Key Takeaways
- A dashboard is only as good as its source data. If stock doesn’t match the shelf, a prettier screen just makes the wrong number more convincing.
- The four numbers that earn their place: true on-hand, stock allocated to open orders (so you can’t oversell), low-stock against a real reorder point, and dead/slow stock.
- The job is to flag the leak early — overselling, phantom stock, a bestseller about to run dry — not to produce a monthly report nobody reads.
- Off-the-shelf inventory tools give you a generic dashboard; the gap is that they rarely match how your warehouse actually moves stock, so the numbers drift.
- You don’t need a £100k WMS to get a trustworthy dashboard. You need stock movements captured properly and one screen built around your real flow.
1The Number on the Screen Is Only as Good as Where It Came From
Start here, because everything else is decoration. A dashboard doesn’t create accurate stock — it displays whatever the system already believes. If your receiving, picking and dispatch aren’t captured as they happen, the dashboard inherits the gap and shows it back to you in a nice font. The most expensive mistake in inventory software is treating the dashboard as the fix when the real problem is upstream: the count was never right to begin with.
This is the wound for most stock-holding SMEs. One inventory manager put it plainly:
A dashboard built on top of that mess doesn’t help; it launders bad data into a clean-looking screen. Before you judge any dashboard, ask where its on-hand figure comes from and how often reality updates it. If the answer is “a periodic count someone types in,” you don’t have a dashboard — you have a snapshot that’s wrong by lunchtime. The fix is in the movements: receive, pick, dispatch, captured at the point they happen. We go deep on that in why stock never matches the system.
2The Four Numbers That Actually Earn Their Place
A good inventory management dashboard is ruthless about what it shows. Most ship with twenty widgets and bury the four that matter. Here are the four that justify the screen:
- True on-hand by SKU and location — not “system stock,” but on-hand reconciled to movements, so the number means something. Per location matters the moment you hold stock in more than one place.
- Allocated / available-to-promise — on-hand minus what’s already committed to open orders. This single column is what stops overselling. If your dashboard shows on-hand but not what’s already spoken for, it will let you sell the same unit twice.
- Low-stock against a real reorder point — not a flat “below 10” rule, but a reorder point tied to lead time and sales velocity, so you reorder the bestseller before it runs dry and not the dead line out of habit.
- Dead and slow-moving stock — what hasn’t moved in 30, 60, 90 days. This is the number nobody asks for and everybody needs, because it’s cash sitting on a shelf.
The contrarian bit: a dashboard with more than these is usually compensating for the fact that none of them are trustworthy. Four numbers that are true beats twenty that aren’t.
3The Leaks a Real Dashboard Closes (in £, not vibes)
A dashboard isn’t a reporting nicety. Each of the four numbers maps to a specific, costed leak:
- Overselling. The system says in stock, the shelf is empty, you take the order, then cancel and refund. The cost isn’t the refund — it’s the customer who never comes back, plus the staff time spent apologising. An available-to-promise column makes this leak structurally impossible.
- Phantom stock. Numbers that drift for no reason. One operator described an “$80k value difference that cannot be explained” in their tool — you can’t close the books or trust a count when value swings without a movement behind it. Auditable movements turn a phantom swing into a traceable event.
- Dead stock. Cash frozen in lines that don’t sell, hidden because nothing on the old report flags age. A slow-moving widget surfaces it so you can discount, bundle or stop reordering it.
- Stockouts on bestsellers. Running dry on the thing that actually sells while overstocking the thing that doesn’t. A velocity-aware reorder point is the difference between a missed sale and a placed one.
Before: a manager reconciling sheet against shelf every week, finding out a job lost money or a customer got cancelled after the fact. After: the same four leaks show up on one screen the morning they start, while they’re still cheap to fix. That before-to-after is the entire return on a dashboard — not the screen, the timing.
4Build vs Buy: Where Off-the-Shelf Dashboards Fall Down
Plenty of inventory SaaS tools ship a dashboard. For a simple, single-location, low-SKU operation, one of them may be exactly right, and you should buy it — building would be overkill. Be honest about that before reading on.
The gap shows up when your warehouse doesn’t move stock the generic way the tool assumes. Off-the-shelf dashboards are built for a generic warehouse, so the numbers drift the moment your real flow differs — a separate goods-in stage, kitting, consignment stock, multi-channel allocation, a bin layout the tool can’t model. You end up with workarounds, and workarounds are where accuracy dies. Operators feel both ends of this: tools that “cost 8 times more than Xero and realistically isn’t giving us 8 times the value,” and accounting packages where you “can’t see what’s on my warehouse like an excel sheet, which is almost free.” Too expensive for the value on one side, too thin on the other.
The other build-vs-buy factor is ownership. SME operators have been burned by lock-in — a platform sunset “by a banner on the vendor’s website” that “invalidates two years’ worth of work,” and price hikes that aren’t “sustainable for a real small manufacturer.” A bought dashboard is rented; the vendor controls the price and the off-switch. A built one you own outright. Neither is automatically right — buy when the generic flow fits and lock-in doesn’t scare you; build when your flow is specific or you want to own the system your stock runs on. The deeper version of this call is in custom inventory systems.
5Right-Sizing It: You Don’t Need a £100k WMS
The trap is thinking the only choices are a free spreadsheet or a six-figure enterprise WMS. Operators say it directly: “QBO is too small, NetSuite is too expensive — what’s a middle ground?” The middle ground is a dashboard built around your actual flow, fed by movements your team will actually capture, scoped to the warehouse you run now.
Right-sizing means three things. Capture stock movements where they happen so the on-hand figure stays true without manual counting. Show the four numbers that matter and resist the rest. And connect to the accounting and order tools you already run instead of demanding a rip-and-replace. That’s a fixed build in the low-thousands-to-tens-of-thousands range, not a 6-figure WMS and not a flaky £/seat/month subscription that punishes you for growing.
If your stock also drives sales orders, the dashboard should tie into how those are picked and fulfilled — see wholesale order management for where stock and orders meet.
Off-the-Shelf Dashboard vs Right-Sized Built-For-You
| Off-the-shelf inventory SaaS | Right-sized built-for-you dashboard | |
|---|---|---|
| Cost | £/seat/month, forever; scales as you grow | Fixed build (£3k–£25k range), then maintained |
| On-hand accuracy | As good as the generic flow fits yours | Built around your receive → pick → dispatch flow |
| Fit to your warehouse | Generic; workarounds for anything unusual | Modelled on your real bins, stages, channels |
| Overselling control | If it tracks allocation; many don’t well | Available-to-promise built in |
| Ownership | Rented; vendor sets price + off-switch | Owned outright; no lock-in, no sunset |
| Right when | Simple, single-site, standard flow | Specific flow, multi-site, or you want to own it |
FAQ
What should an inventory management dashboard show?
The four numbers that drive decisions: true on-hand by SKU and location, stock available to promise (on-hand minus what’s allocated to open orders), low-stock against a real reorder point tied to lead time and velocity, and dead or slow-moving stock by age. Everything else is secondary. A dashboard with twenty widgets but no available-to-promise column can’t stop you overselling, which is the main job. Fewer numbers that are true beats more that aren’t.
How is an inventory dashboard different from a general operations dashboard?
An inventory management dashboard is focused on stock alone — on-hand, allocation, reorder points, dead stock. A general operations dashboard for small business is broader, pulling orders, production, cash and stock onto one screen for the whole business. They overlap, but if your main pain is overselling and counts that don’t match, you want the stock-specific view first. The operations dashboard is the layer above it.
Why don’t my inventory numbers match the shelf even with software?
Almost always because movements aren’t captured where they happen. If receiving, picking and dispatch are typed in later or counted periodically, the system drifts from reality between counts, and the dashboard faithfully shows the drift. Phantom stock — values changing with no movement behind them — is the same problem in software that doesn’t make movements auditable. The fix is upstream of the dashboard: capture every movement at the point it happens. More in why stock never matches the system.
Can I build an inventory dashboard in a spreadsheet?
For a very small, single-location operation, yes — and you should, until it stops coping. The wall you hit is that a spreadsheet can’t capture live movements or stop two people allocating the same stock, so the numbers go stale and the overselling starts. Operators describe running “a million messy spreadsheets” once SKU count and order volume grow. That’s the signal you’ve outgrown it. The next step isn’t a bigger spreadsheet — it’s a dashboard fed by captured movements.
How much does a built inventory management dashboard cost?
For an SME, a right-sized build sits in the low-thousands to low-tens-of-thousands once, depending on how many stages, sites and integrations it covers — not the six figures an enterprise WMS commands, and not a per-seat subscription that grows with you. The cost to weigh it against isn’t the licence; it’s the leaks it closes: cancelled orders from overselling, cash frozen in dead stock, and the hours spent reconciling sheet against shelf every week.
How OpsMavix Can Help
OpsMavix builds right-sized inventory automation systems for stock-holding SMEs who need a dashboard they can actually trust — one where on-hand matches the shelf because the movements behind it are captured properly. We build the four numbers that decide whether you oversell, overstock or run dry — true on-hand, available-to-promise, velocity-aware reorder alerts, dead-stock by age — shaped to how your warehouse really moves and connected to the accounting and order tools you already run. You own it outright: no per-seat fees, nothing a vendor can sunset, no rug-pull.
The honest first step is finding where the stock actually leaks today before building anything. Book an Operations Leak Audit and we’ll map where your counts, allocation and reorder points break down, what it’s costing you in cancelled orders and frozen cash, and whether off-the-shelf or a built-for-you dashboard is the real fit.