
The Cost of Tracking Production on Paper: A 25-Person Maker, Priced
£71,000 a year, on the numbers below
A small-batch manufacturer turning over £2.4M a year runs 25 staff and four workstations on paper job travellers. Priced out, the paper costs roughly £71,000 a year. Every input and every calculation is shown so you can re-run it on your own numbers.
- Vertical
- Small-batch manufacturing
- Revenue
- £2.4M / yr
- Team
- 25 staff, 8 handling paperwork
- Workstations
- 4
- Stack
- Paper job travellers + planning whiteboard + accounts package + spreadsheets
How to read this. This is a worked example of a representative operation — not a named client. Every figure is a transparent calculation you can re-run against your own numbers. No testimonials, no invented results.
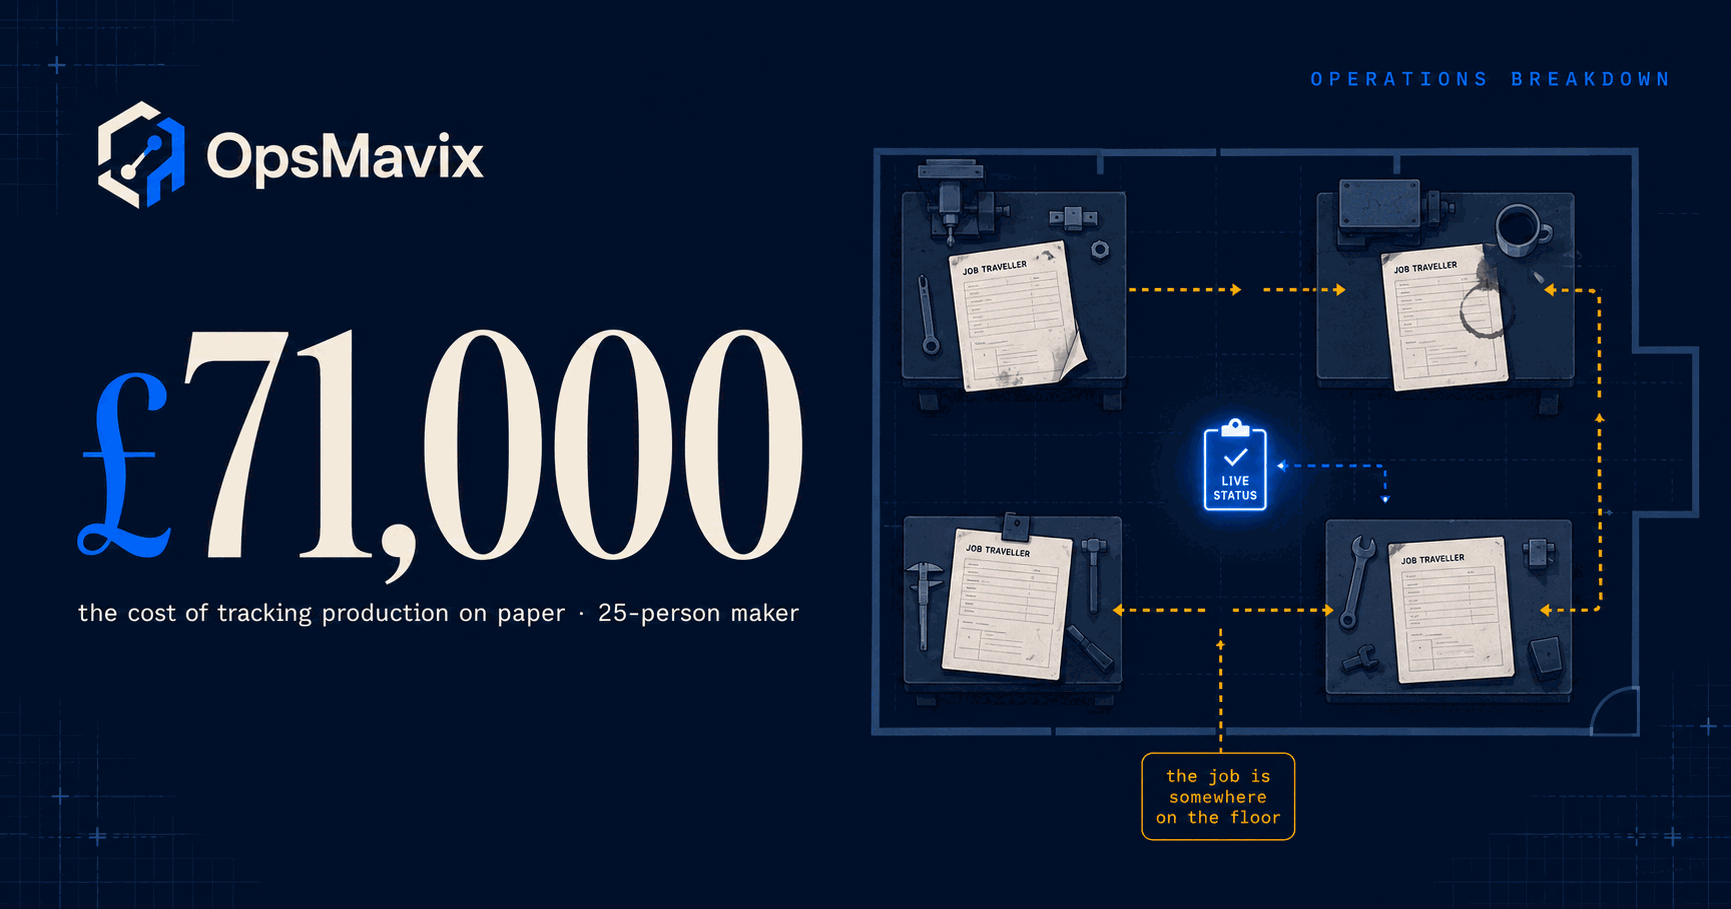
Quick summary: A small-batch manufacturer turning over £2.4M a year, running 25 staff and four workstations on paper job travellers, loses roughly £71,000 a year to the paper itself. It splits three ways — about £35,000 chasing job status, about £18,000 in rework caused by paperwork failures, and about £18,000 in late jobs and expedited despatch.
The setup
Twenty-five people. Four workstations — cut, form, assemble, finish — and a despatch bench at the end. Every job starts as a printed traveller: job number, customer, quantity, drawing reference, four operation boxes with space for initials and a time, and a QC section at the bottom. The traveller lives in a plastic wallet that moves with the batch. When an operation is done the operator writes the finish time and initials the box. At the end of the shift the supervisor walks the floor, reads the wallets and updates a magnetic whiteboard in the office. On Friday someone types the finished travellers into a spreadsheet so the accounts package can be invoiced against them. The whiteboard is the plan, the wallet is the truth, the spreadsheet is the history, and none of the three agree for more than an hour at a time.
Nothing here is visibly broken. Jobs get made, customers get their orders mostly on time, the travellers are legible, and the supervisor genuinely knows where most things are. That is exactly why the leak survives: no incident to point at, no dropped ball, no line on the profit and loss account called “paper”. There is only a production manager who spends the first hour of every day walking the floor to find out what happened yesterday, an office that answers “let me go and check” to every customer, and a standing assumption that the shop is always a bit behind. The cost is real, and it is distributed across salaries, a materials line, a carriage line and the occasional credit note, so nobody sees it summed.
1Chasing job status across the floor — ≈ £35,000
The paper does not report. It sits in a wallet on a bench, and the only way to know what it says is for a human to walk over and read it. That single property is where most of the money goes. Every question starting with “where is” — where is job 4471, where is the batch that should have gone out yesterday — is answered by somebody physically going to look, then telling somebody else, who writes it somewhere that will be stale within the hour.
It compounds because the answer is perishable. The production manager builds a picture of the floor first thing; by eleven it is wrong, so when the customer rings at two he rebuilds it. Two supervisors spend the day being interrupted by the same question from four directions — office, despatch, the managing director, an operator wanting to know what is next. Four operators lose time hunting for a wallet that walked off with the previous batch, or waiting while somebody finds the current drawing revision. And on Monday eight people sit in a meeting where the first half hour goes on reconstructing last week. Same pathology as shop floor WIP tracking: the work is visible, the state of the work is not.
- Production manager building and rebuilding the daily picture: 1 hr/day × 230 working days = 230 hours
- Two supervisors fielding status questions: 2 × 40 min/day × 230 days = 307 hours
- Two office staff going to find answers for customers: 2 × 25 min/day × 230 days = 192 hours
- Four operators hunting for travellers, drawings and the right revision: 4 × 15 min/day × 230 days = 230 hours
- Weekly production meeting overrun spent reconstructing last week: 8 people × 30 min × 46 weeks = 184 hours
- Total ≈ 1,143 hours, call it 1,150 hours a year
- At a blended £20/hour across operators, supervisors and office staff → £23,000
- Plus the decision drag: lead times quoted from a picture that is a day old, jobs started in the wrong order, a machine idle because nobody knew the previous op had finished. Charged conservatively at 0.5% of £2.4M turnover → £12,000
Leak 1 total: ≈ £35,000 a year.
2Rework from lost or wrong paperwork — ≈ £18,000
This is the leak that gets misfiled. When a batch is remade because it was built to a superseded drawing, the post-mortem says “quality issue” or “operator error”. It is neither. It is a document control failure wearing a scrap tag.
Four things cause almost all of it. A revision changes and the traveller still carries the old reference, because the wallet has been on the floor for nine days. An operation box gets initialled in the wrong row, so the next station believes a step was done that wasn’t. A wallet gets separated from its batch during a changeover and the batch is finished from memory. And a customer amendment arrives by email, gets relayed verbally, and never reaches the paper the operator is working from. None of these are exotic. All four happen in shops where everyone is competent, because the control document is a sheet of A4 with no version, no audit trail and no way of announcing it has gone stale. See job cost sheet for how the remake then gets absorbed into the original job and disappears.
- Roughly 1,200 jobs a year through four workstations
- Paperwork-caused failures — wrong revision, missed amendment, skipped or mis-signed operation, lost wallet — affect 3.5% of jobs → 42 jobs
- Cost of putting one of those right, built up: 6 hrs of shop labour at £20 = £120, materials remade = £190, displaced capacity on the workstation that now has to run it twice = £120
- Total per affected job = £430
- 42 jobs × £430 = £18,060
- Cross-check: 0.75% of £2.4M turnover = £18,000
Leak 2 total: ≈ £18,000 a year. Note what this deliberately excludes: design-caused defects, supplier material faults, machine-caused scrap and every external failure cost. It counts only rework whose root cause is a piece of paper being wrong, missing or out of date.
3Late jobs and expedited despatch — ≈ £18,000
A paper shop finds out a job is late at the point it should have shipped. There is no earlier signal, because nothing is watching the traveller against a promised date — the promise lives in the accounts package or an email, the progress lives in a wallet on a bench, and the two are never compared until despatch goes looking for a batch that isn’t there.
What follows is a recovery operation, and recovery costs money three ways. Somebody re-plans the afternoon, pushing something else late. Somebody stays until seven to finish it. Somebody pays for a carrier who will move it tomorrow instead of the day after. A handful of times a year a customer also gets carriage waived or a credit, because the sales conversation goes better with something in it. Whether a shop this size needs full shop floor tracking software is a separate question; what it needs first is a promised date sitting next to a real one.
- Unplanned re-planning and despatch scrambling: ~3 hrs/week × 46 weeks = 138 hours, plus ~12 after-hours despatch pushes at 1 hr each = 12 hours → 150 hours at £20/hr = £3,000
- Of 1,200 jobs a year, about 7% ship late enough to need intervention → 84 jobs
- Premium next-day carriage instead of standard on those consignments, ~£55 extra each: 84 × £55 = £4,620
- Overtime to recover the schedule: 350 hrs at a £10/hr premium (time-and-a-half on a £20 base) = £3,500
- Goodwill on the worst cases — carriage waived or a credit — on ~18 orders averaging £380 = £6,840
- £4,620 + £3,500 + £6,840 = £14,960
- Cross-check: 0.625% of £2.4M turnover = £15,000
- £3,000 + £15,000 = £18,000
Leak 3 total: ≈ £18,000 a year.
The total: ≈ £71,000 a year
£35,000 + £18,000 + £18,000 = £71,000 on £2.4M of turnover — roughly 3% of revenue. On an assumed net margin of 6–8% — substitute your own — that is £144,000–£192,000 of annual profit at this turnover, so the paper takes between a third and a half of what the business actually keeps.
None of it appears as a line on the profit and loss account. There is no cost code called “walked over to look at a wallet”. The £35,000 sits inside salaries that would be paid anyway, so it reads as normal staffing. The £18,000 of rework sits in a materials line and a labour line, filed under quality. The £18,000 of lateness splits between a carriage bill that looks like carrier pricing, an overtime line that looks like demand, and credit notes that look like customer service. Every pound is real and every pound is invisible in the accounts — which is why an operation can run this way for a decade with nobody behaving badly and nobody noticing.
Where these numbers come from
Every input above is either an assumption stated in full so you can replace it, or anchored to a published figure. Here are the anchors and their limitations.
- The £20/hour blended rate. ONS, Employee earnings in the UK: 2025 (Annual Survey of Hours and Earnings) puts median gross hourly earnings excluding overtime for UK full-time employees at £19.67 in April 2025, up from £18.66 the year before, and notes that process, plant and machine operatives saw median hourly pay rise 6.3% that year. £20 is used here as a blend across operators, supervisors and office staff, and it is conservative: with employer National Insurance and pension added, the supervisor and production-manager hours in Leak 1 — the hours doing most of the chasing — cost materially more than £20.
- Why status reconstruction is normal, not negligent. The Manufacturer, reporting the Dun & Bradstreet Manufacturing Pulse Survey 2025 (18 December 2025) states that only 36% of manufacturers feel they can make informed business decisions with their existing data, that around a third of firms say key decision-making processes are mostly manual, and that 41% distrust their current supply chain data. That is the environment Leak 1 describes: decisions taken from a picture somebody rebuilt by hand that was already going stale. Caveat — the article is partner content published by the survey’s sponsor, so treat it as directional evidence that manual decision-making is widespread, not as a measurement of your shop.
- Why 0.75% of turnover for rework is a low number, not a high one. Quality Digest, “What Is Your Company’s Cost of Poor Quality?” (Shellye Archambeau, 2004) states that “experts have estimated that COPQ typically amounts to 5–30 percent of gross sales for manufacturing and service companies”, and works the example through a manufacturer with annual sales of about £185m (converted) at a 20% cost of poor quality. Two caveats: it is from 2004, and “experts have estimated” is a band, not a measurement. It is used for direction of travel only — Leak 2 charges 0.75% of turnover, a fraction of even the bottom of that band, because it counts paperwork-caused rework alone.
- Whether a fix of this size is plausible. Made Smarter, Technology Adoption Pilot report reports that over 80% of SMEs working with the programme saw a boost in productivity after adopting technology, that 75% of North West SME manufacturers had invested in new technology in the previous three years, and that 1 in 8 are smaller makers who have never invested in technology at all. Both halves matter: a 25-person shop still running paper travellers is normal rather than an outlier, and productivity gain from digitising manual work is a documented programme-level outcome — not a promise about your numbers.
Source figures published in US dollars are converted at approximately 1.35 dollars to the pound and marked “(converted)”. Working days are 230 per person per year — 261 weekdays less eight bank holidays and 23 days of leave — and 46 working weeks for anything counted weekly. Figures are rounded, with the unrounded value shown alongside.
What closing it looks like
- “Where is it” stops being a question anyone has to walk to answer. The traveller becomes a job record each station updates as work passes through, so the state of every job is readable from the office and the floor in the same second.
- Rework caused by a stale document stops. An operation running against a superseded revision cannot be booked complete, and a customer amendment attaches to the job rather than to somebody’s memory of a phone call. Design-caused and material-caused defects remain — a different problem, untouched by this.
- Late jobs announce themselves early. A promised date beside real progress means the warning arrives with days of runway, recoverable with a schedule change rather than with overtime and a premium carrier.
- The Monday meeting stops being an archaeology session. The picture already exists, so the half hour spent reconstructing last week gets spent deciding about next week — and job costing stops depending on a Friday typing exercise.
- Payback, honestly. A right-sized operations system for a shop this shape is a Starter Fix or a small Growth System build. Against a £71,000 leak that typically pays back inside the first year, usually on the chase time alone. But it depends entirely on operators booking their own work at the station. Keep the paper and add a screen and you have bought a second system to maintain and recovered nothing.
FAQ
Is this a real client?
No. It is a representative worked example built from patterns common to small-batch manufacturing, not a named customer, and nothing in it should be read as a case study or a result. Every input — hours, rates, job volumes, failure percentages, carriage premiums — is stated in the open so you can substitute your own figures and re-run the arithmetic on paper. If your numbers come out smaller, that is a useful answer too.
What is the cost of tracking production on paper in a smaller shop?
It scales with turnover and hand-offs, not headcount. A ten-person shop with two workstations sees a fraction of the £35,000 chase figure — fewer people to interrupt, a shorter walk. But 2–3% of turnover is a reasonable first estimate anywhere the control document is a printed sheet and the plan is a whiteboard. Below roughly £750k the arithmetic often says leave it alone, which is a legitimate outcome. Use the calculator below with your own revenue and rate rather than scaling this example.
Isn’t the answer just to buy an MES?
Usually not at this size. A manufacturing execution system is built for a plant with dozens of machines, sensor-level capture and shift patterns to schedule against, and its licence, implementation and administration frequently cost more than the £71,000 it was bought to recover. Almost all of this leak comes from three modest capabilities: a job record each station can update, a promised date next to actual progress, and a revision that cannot be ignored. That is the territory covered in shop floor job tracking without an ERP — a business too messy for spreadsheets and not ready for a full ERP is better served by an owned operations system sized to its actual flow.
Why price the paper rather than just replace it?
Because a change nobody has costed is an opinion, and opinions lose to whoever is most confident in the room — usually the person who says the travellers have worked fine for fifteen years. True, and not the point. Once the paper has a number against it the argument changes shape: it stops being “should we digitise the shop floor” and becomes “is the fix cheaper than £71,000 a year”. That is a decision a managing director can make in one meeting, with a calculator.
Run the same maths on your operation
The defaults reproduce the worked example above exactly — same formulas, nothing hidden. Move them to your own figures and every line recomputes.
- Chasing job status across the floor£35,000
- Rework from lost or wrong paperwork£18,000
- Late jobs and expedited despatch£18,000
Each leak = (hours a year × team size ÷ 8 × hourly cost) + (revenue × that leak's share). Hours scale with the admin team, the rest with turnover. Illustrative, and deliberately simple enough to argue with.
The Paper Traveller Worksheet
The same breakdown as a one-page PDF — the figures, the maths, and the assumptions behind them. No email needed.
Download the PDF (free) ↓The full cost model
The full model: every line item, the sensitivity ranges, and the worksheet to run it on your own numbers. We email it to you — one confirm click, unsubscribe anytime.