
The Cost of Running Inventory on Spreadsheets: 12,000 SKUs at a £6M Wholesaler, Priced
£147,000 a year, on the numbers below
A £6M wholesale distributor runs 12,000 SKUs across two warehouses on one master stock workbook and six people. Priced honestly, the spreadsheet costs about £147,000 a year in admin time, stock errors and overstocked cash. Every figure is shown so you can re-run it on your own numbers.
- Vertical
- Wholesale distribution
- Revenue
- £6M a year
- Team
- 6 people on stock admin
- Scale
- 2 warehouses, 12,000 SKUs
- Stack
- accounts package plus a master stock workbook
How to read this. This is a worked example of a representative operation — not a named client. Every figure is a transparent calculation you can re-run against your own numbers. No testimonials, no invented results.
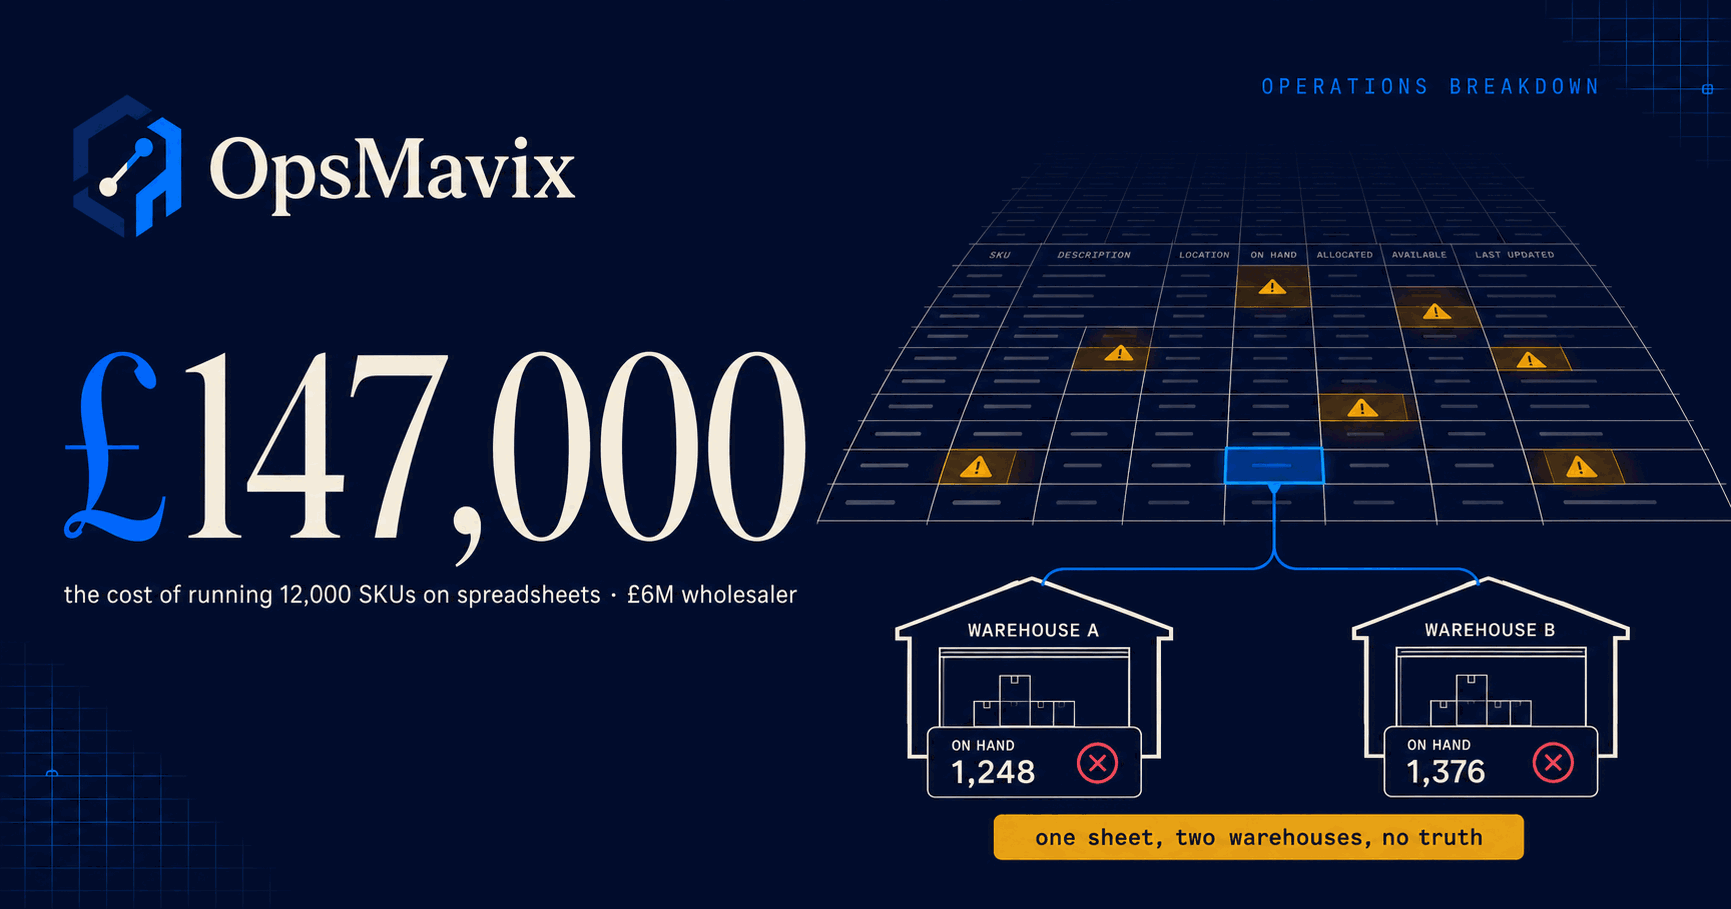
Quick summary: A £6M wholesale distributor running 12,000 SKUs across two warehouses on a master stock workbook and six people on stock admin loses roughly £147,000 a year to that spreadsheet — split across maintaining it, the errors it causes, and the surplus stock it hides. None of it appears as a line on the profit and loss, which is precisely why it survives for years.
The setup
The business buys in volume and sells to trade customers — a few hundred accounts, orders arriving by email, phone and a trade portal. Around 10,000 sales orders a year, averaging four lines each. Stock sits in two warehouses: a main site holding the bulk, and a second site opened three years ago that was meant to be temporary. Gross margin runs around 25%, so cost of goods is roughly £4.5M, and stock turns about four and a half times a year — an average of £1M of goods sitting on shelves at any moment.
The system of record is a workbook. It has a tab per warehouse, a master tab that sums them, a lookup table of supplier lead times that was last reviewed in 2023, and a pivot that only one person can rebuild. Goods-in write receipts on a clipboard and someone types them up. Pickers mark a printed sheet and someone types that up too. Every morning the master is a day behind; on Mondays it is three days behind. Nothing here is visibly broken. Orders ship, customers get served, the accounts reconcile at year end. That is the problem — a leak that produced a visible failure would have been fixed years ago. This one just quietly never matches the system and everyone has learned to work around it.
1Maintaining and reconciling the sheets — ≈ £53,000
Six people touch stock admin, and a meaningful slice of their week goes into keeping the workbook approximately true rather than into buying, selling or shipping. It is typing goods-in notes, typing pick sheets, reconciling the two warehouse tabs against a master that has drifted, rebuilding a formula someone dragged over, and answering “which version is the current one” over Teams. Month-end is worse: someone spot-counts the fast lines, argues with the sheet, and posts an adjustment.
The second half of this leak is subtler and larger. Because the sheet is always a day or two behind reality, buying and promising run on stale figures. That produces expedited replenishment at short notice, small top-up orders bought at list price instead of at a break quantity, and inter-warehouse transfers that only happen because nobody could see what the other site already had.
- Sheet upkeep across the team: 25 hours a week — roughly 10 hrs typing daily stock movements for both sites, 8 hrs reconciling the two warehouse tabs against the master, 4 hrs of month-end close averaged across the year, 3 hrs repairing broken formulas and chasing versions
- 25 hrs × 46 working weeks (allowing holiday and bank holidays) = 1,150 hours a year
- 1,150 hrs × £20/hour loaded cost (salary plus employer costs) = £23,000
- Decisions taken on stale numbers, costed at 0.5% of £6M turnover = £30,000, made up of roughly £18,000 in expedited freight and small-quantity buys at list rather than break price, and £12,000 in avoidable inter-warehouse transfers
- £23,000 + £30,000
Leak 1 total: ≈ £53,000 a year.
2Stock errors, mis-picks and write-offs — ≈ £54,000
This is the leak the team feels but never adds up, because each instance is small and lands in a different place. A picker goes to the location, the quantity is not what the sheet said, so they substitute, short-ship or pick from the other site. A customer gets the wrong item and a credit note follows. At the annual count, the physical and the recorded diverge and the difference is written off in one journal that nobody interrogates line by line. Goods-in books a delivery as complete because the paperwork said so, and the supplier invoice gets paid against a quantity that never arrived.
The underlying rate is not exotic. Research on human error puts base error rates for simple cognitive actions — writing, calculating, entering a value — in the 1% to 5% band, and fourteen spreadsheet-development studies average a 3.9% cell error rate, in the upper half of that band. A spreadsheet stock system stacks two of those actions on top of each other: someone reads a figure and someone types a figure. Using 1.2% here sits at the optimistic end of the evidenced range, not the pessimistic one. The types of stock discrepancy differ, but they all resolve to the same arithmetic.
- Order lines a year: 10,000 orders × 4 lines = 40,000 lines
- Line error rate of 1.2% (just above the 1% floor of the evidenced range) = 480 errored lines
- All-in cost per error — re-pick, re-pack, return carriage, credit note, admin chase — at £50 → £24,000
- Average stock value: cost of goods £4.5M ÷ 4.5 stock turns = £1.0M on the shelves
- Net stock written off at count at 1.8% of £1.0M = £18,000
- Purchases of £4.5M a year with no line-level three-way match; under 0.3% of purchase value paid on short deliveries and unchallenged price variances = £12,000
- £24,000 + £18,000 + £12,000
Leak 2 total: ≈ £54,000 a year — equal to 0.9% of turnover.
3Overstock tying up cash and space — ≈ £40,000
With 12,000 SKUs and no reorder points, buying happens by memory and by whatever the last big order was. There is no min/max on the sheet that anyone trusts, no reliable lead-time column, and no view of what the other warehouse is holding. The safe move for a buyer who cannot see the truth is to over-order, and over the years that produces a stock profile with a long tail of lines nobody has sold in eighteen months, plus duplicated buffer at both sites for the same SKU.
There is also a time cost in the buying itself. Building a reorder list by eye across 12,000 rows takes hours that a reorder point system would take minutes over.
- Manual reorder work: monthly review across both sites (2 × 4 hrs × 12 = 96 hrs), quarterly slow-mover and dead-stock review (2 × 8 hrs × 4 = 64 hrs), ad-hoc “do we already have this” checks (40 hrs) = 200 hours a year
- 200 hrs × £20/hour = £4,000
- Average stock £1.0M, of which an estimated 15% is genuine surplus beyond what a reorder-point discipline would hold = £150,000 of excess stock
- Carrying cost at 24% a year, built from components below rather than borrowed from a vendor’s rule of thumb: 8% cost of the money, 8% storage, handling and warehouse labour attributable to the surplus, 2% insurance and admin, 6% obsolescence, damage and eventual markdown
- £150,000 × 24% = £36,000
- £4,000 + £36,000
Leak 3 total: ≈ £40,000 a year — equal to 0.6% of turnover plus 200 hours.
The total: ≈ £147,000 a year
£53,000 + £54,000 + £40,000 = £147,000, or about 2.45% of turnover, in a business whose net margin is probably in the high single digits. On those margins, £147,000 of leak is the profit on roughly £1.5M–£2M of sales.
Not one pound of it appears as a line on the profit and loss. The £23,000 of sheet upkeep and the £4,000 of manual reorder work are inside salaries that would be paid anyway. The £30,000 of stale-data buying is inside cost of goods and carriage. The £24,000 of mis-picks is inside credit notes and courier charges. The £18,000 of write-offs is one journal at year end. The £12,000 of short deliveries and unchallenged price variances is inside purchase invoices that were paid without argument. The £36,000 of carrying cost is inside rent, insurance, interest and eventual markdowns. Those seven components are the whole £147,000: every one of them is real money leaving the business, and every one is hidden inside a category that looks normal. That is the whole reason a leak of this size survives for a decade: there is nothing to point at.
Where these numbers come from
Vendor listicles assert that spreadsheets are expensive and then quote a round figure. Here are the external anchors behind each input above, so the estimate can be argued with rather than believed.
- The £20/hour loaded rate. The ONS Annual Survey of Hours and Earnings 2025 puts median gross hourly pay excluding overtime for UK full-time employees at £19.67 in April 2025. Add employer National Insurance and pension and the loaded cost of an admin or warehouse-office hour is above £20, so £20 understates the time cost rather than inflating it.
- The 1.2% data-entry error rate. Raymond Panko’s What We Don’t Know About Spreadsheet Errors Today (EuSpRIG 2015) reports base error rates of 1% to 5% for simple cognitive actions such as calculating and writing statements, and a 3.9% cell error rate across 14 spreadsheet-development studies covering 967 participants. Using 1.2% for a read-then-type stock movement sits just above the floor of that evidence, not at its middle.
- What carrying cost actually contains. The open textbook Fundamentals of Operations Management, 8.4 Relevant Costs breaks holding cost into financing, storage and handling, inventory risk (deterioration, obsolescence, shrinkage, damage) and insurance, and works its standard example at 20% per annum. CIPS, the UK procurement institute, lists the same components: storage, insurance, depreciation from ageing or obsolescence, and the salaries of the people managing the stock.
- The 8% cost of capital inside that 24%. Bank Rate is 3.75% as of the Bank of England’s June 2026 decision. A £6M wholesaler funding stock on an overdraft, invoice finance or a trade facility pays several points above base, so 8% is a fair working cost of money tied up in surplus goods.
- A note on the “20–30%” figure everyone quotes. That range is a practitioner planning convention rather than a measured statistic — Wikipedia’s version of it carries a citation-needed tag, and the professional bodies that publish it sit behind member paywalls. That is exactly why the 24% above is assembled from four named components instead of cited to a supplier’s blog. Swap any component for your own number and the total moves accordingly.
Every figure in this breakdown is either an input you can check against your own accounts (turnover, headcount, stock value, order count) or a rate anchored to one of the sources above. Nothing is borrowed from a case study.
What closing it looks like
The point of pricing a leak is to make the alternative comparable. A right-sized operations system — one stock record, both warehouses, live — changes what happens on a Tuesday morning rather than adding a dashboard.
- The typing stops. Goods-in and picking are captured where they happen, once, so the 1,150 hours of transcribing and reconciling largely disappear rather than moving to a different person.
- The two sites stop disagreeing. One stock record covering both warehouses means buyers can see total position before they order, which removes most of the emergency freight and the pointless transfers between sites.
- Errors get caught at the point of the mistake, not at year end. A pick that does not match the record fails immediately, and a delivery that arrives short cannot be matched to a full invoice.
- Surplus becomes visible. Reorder points and slow-mover reporting turn “we might have too much of that” into a list with values on it, which is the only way £150,000 of excess stock ever gets released.
- Payback, honestly. A build of this shape sits in the £10,000–£25,000 Growth band. It will not recover all £147,000 — no system does, and anyone promising that is selling. Recovering a third is about £49,000 a year, which clears the build inside the first year and continues after. Recovering half is a very good outcome. Judge it on the third.
FAQ
Is this a real client?
No. It is a representative worked example built from a composite of how wholesale distributors of this size actually run, and every figure is shown so it can be re-run on your own numbers. OpsMavix does not publish client results, invented or otherwise. If a number here does not match your operation, change it — the arithmetic is deliberately simple enough to redo on paper.
Isn’t £147,000 just what it costs to run a stock function?
Part of it is. Someone has to receive goods, count things and place orders, and no system removes that. The question is how much of the £147,000 is work and how much is friction. The 1,150 hours are not spent controlling stock; they are spent making a spreadsheet agree with itself. The £54,000 of errors and the £36,000 of carrying cost are not the price of holding inventory — they are the price of not being able to see it.
Our spreadsheet is very well built. Does this still apply?
The quality of the workbook affects the formula-error component and almost nothing else. A well-built sheet still cannot capture a pick at the moment it happens, still cannot show two warehouses in real time, and still cannot stop a buyer ordering stock that is already sitting at the other site. The discrepancies that cost money come from the gap between the event and the entry, not from the formulas.
At what point is a spreadsheet genuinely the right answer?
When the cost of the leak is below the cost of the fix, which for most operations means low SKU counts, one location, and a stock value small enough that carrying cost is noise. Below roughly £1M of turnover with a few hundred lines, a disciplined sheet is usually correct. Somewhere between there and here, the arithmetic flips — and the useful exercise is finding out where your business sits, not assuming.
Run the same maths on your operation
The defaults reproduce the worked example above exactly — same formulas, nothing hidden. Move them to your own figures and every line recomputes.
- Maintaining and reconciling the sheets£53,000
- Stock errors, mis-picks and write-offs£54,000
- Overstock tying up cash and space£40,000
Each leak = (hours a year × team size ÷ 6 × hourly cost) + (revenue × that leak's share). Hours scale with the admin team, the rest with turnover. Illustrative, and deliberately simple enough to argue with.
The spreadsheet stock leak worksheet
The same breakdown as a one-page PDF — the figures, the maths, and the assumptions behind them. No email needed.
Download the PDF (free) ↓The full cost model
The full model: every line item, the sensitivity ranges, and the worksheet to run it on your own numbers. We email it to you — one confirm click, unsubscribe anytime.