
The Cost of Outgrowing Linnworks: A £5M Multi-Channel Seller at the Tier Ceiling, Priced
£119,000 a year, on the numbers below
A multi-channel retailer turning over £5M a year, five people in ops, 60,000+ SKUs, sat at the top of its platform tier. Priced out, staying there costs roughly £119,000 a year — licence, workaround labour and sync-lag oversells combined. Every input is shown so you can re-run it on your own numbers.
- Vertical
- Multi-channel retail
- Revenue
- £5M / yr
- Team
- 5 in operations
- Catalogue
- 60,000+ SKUs, ~100,000 orders/yr
- Stack
- Multi-channel inventory platform (top tier) + Excel + accounting package
How to read this. This is a worked example of a representative operation — not a named client. Every figure is a transparent calculation you can re-run against your own numbers. No testimonials, no invented results.
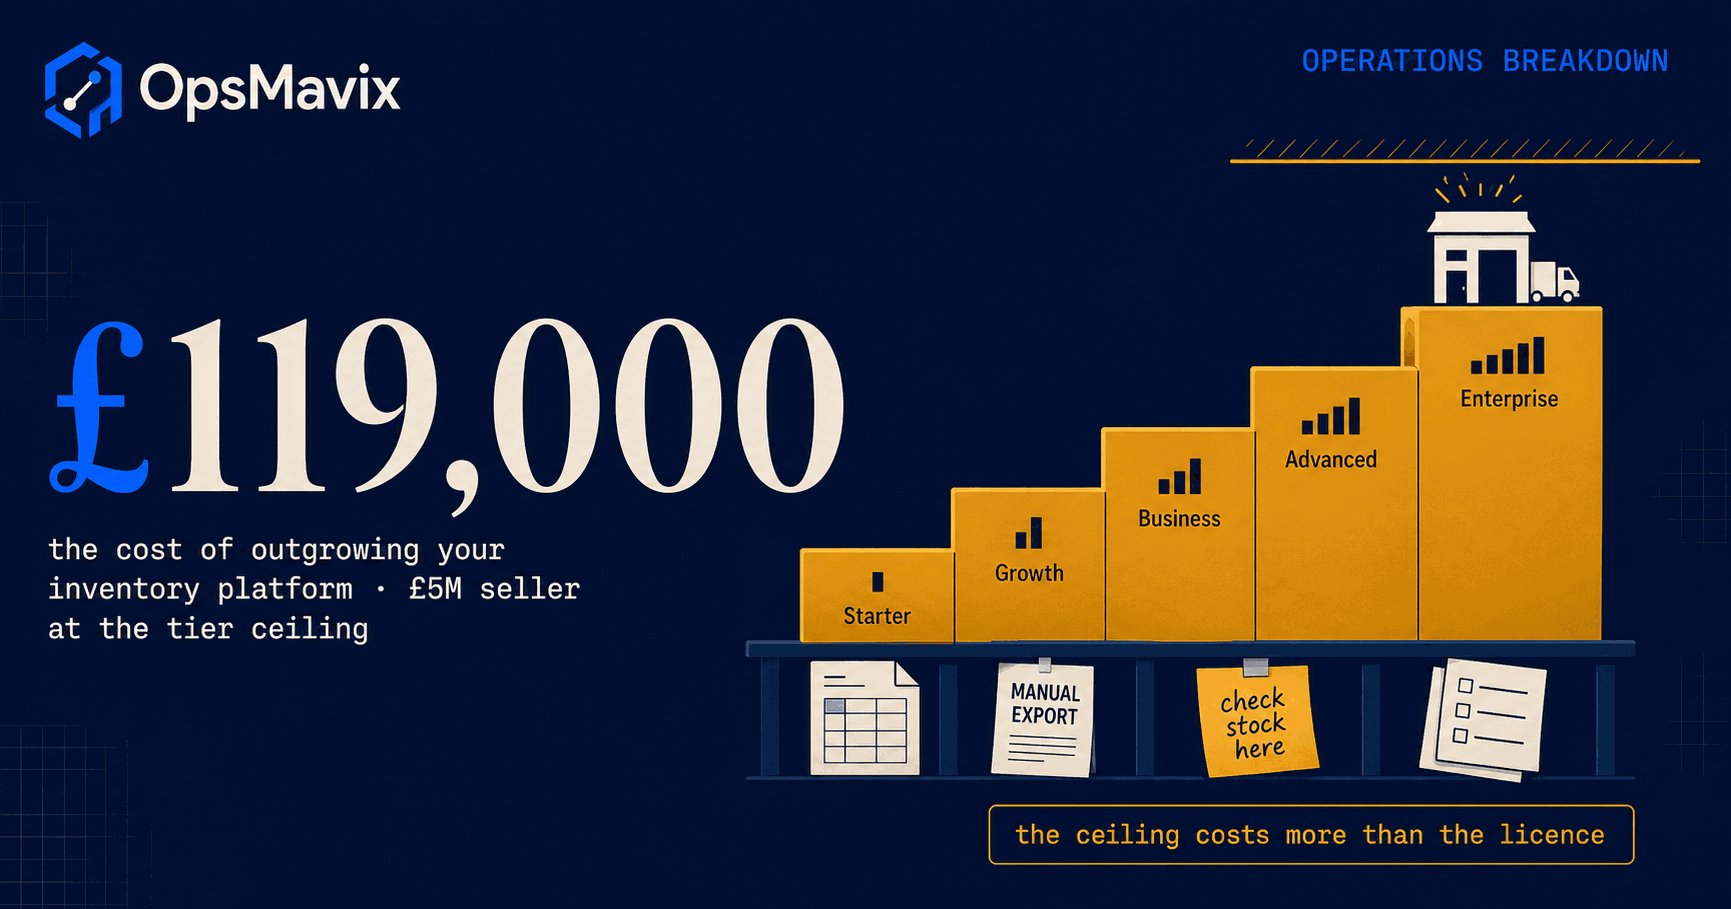
Quick summary: A multi-channel retailer turning over £5M a year, running 60,000+ SKUs and five people in ops from the top tier of its inventory platform, pays roughly £119,000 a year for the privilege of staying there. It splits three ways — about £24,000 in platform cost at the tier ceiling, about £48,000 in workarounds and manual exports, and about £47,000 in sync lag and oversells.
The setup
Five sales channels: a Shopify storefront, Amazon UK and DE, eBay, and a growing wholesale book that arrives by email and PDF. Around 100,000 orders a year at a blended £50 average order value. The catalogue passed 60,000 SKUs two range extensions ago, and a good chunk of it is variants, bundles and kits sharing components with each other. Stock sits across a main warehouse and an overflow unit taken on eighteen months back when the mezzanine ran out. The ops team is five: two on despatch, one on purchasing, one on listings and channel admin, one team lead who does whatever is on fire. They have been on the same inventory platform for six years, at the top of its order-volume tier.
Nothing here is visibly broken. Orders download, labels print, the couriers collect, the marketplaces stay green most weeks. That is exactly why this leak survives: the platform does what it was bought to do, and everything it does not do has quietly been absorbed by a spreadsheet, a nightly export, or a person who has stopped noticing they do it. There is no incident to point at. There is only a subscription that gets more expensive every renewal, an ops team of five that never gets ahead, and a cancellation rate everybody watches nervously on Monday mornings. The cost is real, it is large, and it is spread across three places nobody adds together.
1Platform cost at the top tier — ≈ £24,000
The first leak is the only one that arrives as an invoice, which is why it is the only one anybody argues about. Linnworks does not publish tier prices; its pricing page states that plans are priced on order volume rather than revenue, that advanced functionality is sold as add-on modules so you “pay only for what you need”, and that onboarding is “a one off fee calculated on your best fit package”. All three are reasonable commercial choices. All three also mean the bill for an operation like this one is a function of how much it sells.
At roughly 8,300 orders a month this operation is not on an entry plan. It sits at or near the top of an order-volume band, with warehouse and forecasting functionality bought as separate modules because a two-site operation with kits needs them. The renewal conversation is the same every year: volume went up, so the plan goes up. That is not a criticism of the pricing model — it is a description of what a volume-priced licence does to a business whose whole plan is more volume. Worth reading alongside a plain breakdown of Linnworks pricing before assuming the figure below is the ceiling rather than the current rung.
- Core subscription at the top of the order-volume band the operation sits in: £1,450/month → £17,400/year
- Add-on modules billed separately (warehouse management plus forecasting and analytics): £400/month → £4,800/year
- One-off onboarding and implementation fee of £5,400, amortised across three years → £1,800/year
- £17,400 + £4,800 + £1,800 = £24,000
- Cross-check: 0.48% of £5M turnover = £24,000
Leak 1 total: ≈ £24,000 a year.
2Workarounds, exports and re-entry — ≈ £48,000
This is the leak nobody counts, because it is not one task. It is forty small ones, each taking fifteen minutes, each done for so long it has stopped registering as work. The listings admin exports channel stock every morning and eyeballs it against the platform figure, because the bundles do not always decrement the way anyone expects when a component sells on two channels at once. The buyer rebuilds a reorder sheet in Excel every Monday, because the forecast she needs runs off her own supplier lead times and minimum order quantities rather than a rolling average. Wholesale orders arrive as PDFs and get typed in by hand — around 2,600 a year of them. Month end is three and a half days of pivot tables, because the report the finance director wants has never existed as a report.
None of that means the platform is deficient. Most of it is the ordinary residue of an operation whose shape changed faster than its configuration — two sites, kits made of other kits, a wholesale channel bolted onto a retail system. The point is not whose fault it is. The point is that five people absorb it, it costs a specific amount, and none of that money has a cost code.
- Daily channel stock reconciliation and export checks: 1.5 hrs/day × 5 days = 7.5 hrs/week × 46 working weeks = 345 hours
- Rebuilding the purchasing and reorder sheet in Excel: 4 hrs/week × 46 weeks = 184 hours
- Re-keying ~2,600 wholesale orders arriving by email and PDF: 5 hrs/week × 46 weeks = 230 hours
- Month-end reporting pack rebuilt by hand: 26 hrs/month × 12 = 312 hours
- Bundle, kit and two-site stock corrections: 4 hrs/week × 46 weeks = 184 hours
- Chasing failed syncs, re-uploading CSVs, fixing listing errors: ~12 hrs/month × 12 = 144 hours
- Total ≈ 1,399 hours, call it 1,400 hours a year
- At £20/hour (ONS median full-time hourly pay of £19.67, used flat rather than loaded) → £28,000
- Plus the rework that manual handling creates, charged at 0.4% of £5M turnover → £20,000, built as: credit notes and price corrections on 2,600 re-keyed wholesale orders at a 3% error rate × £95 average correction cost = £7,410; 26 expedited inbound shipments a year at £280 premium each because the reorder sheet was a week stale = £7,280; stock ordered twice against a figure that had already moved, written down at £5,310
- £28,000 + £20,000 = £48,000
Leak 2 total: ≈ £48,000 a year.
3Sync lag, oversells and manual fixes — ≈ £47,000
Every multi-channel hub has a refresh window. Stock changes in one place, and there is a gap — seconds, minutes, occasionally longer during a bulk update or a marketplace API slowdown — before every other channel knows. That is a property of the architecture, not a fault in any one vendor’s product. At 100,000 orders a year, though, the window has traffic in it. A last-unit SKU that sells on Amazon at 11:04 and again on eBay at 11:06 is two orders and one unit, and somebody has to decide which customer gets bad news.
That decision costs more than the cancelled order, because the marketplaces price it for you. Amazon’s Order Performance programme policy states that sellers must keep their Order Defect Rate under 1% and their pre-fulfilment Cancellation Rate under 2.5%, and that breaching either “may result in loss or restriction of selling privileges”. eBay’s seller standards policy requires “no more than 2% of transactions” with defects, and counts one when “the seller cancels the order unexpectedly (e.g. because it was out of stock)”. So the team does the rational thing: it pads stock on fast movers so the counts never get close enough to bite. That buffer is real money sat on a shelf doing nothing, purely to absorb a timing gap. It is the most expensive single line here and the most invisible, because on the balance sheet it looks like inventory rather than a workaround.
- 100,000 orders/year at a blended £50 average order value
- Oversell rate of 0.8% across the sync-lag window → 800 affected orders a year
- Of those, 500 cancelled outright: 500 × £50 × 32% contribution margin = £8,000 lost contribution
- 300 honoured at extra cost — bought in at short notice, expedited, or split into two parcels: 300 × £38 = £11,400
- Resolution admin, refunds, apologies and replacement sourcing: 800 × 0.3 hrs = 240 hours × £20 = £4,800
- Buffer stock carried purely to absorb the lag: £130,000 average value × 14% annual holding cost = £18,200
- Marketplace and shipping fees not recovered on the 500 cancellations: 500 × £9.20 = £4,600
- £8,000 + £11,400 + £4,800 + £18,200 + £4,600 = £47,000
- Cross-check: 0.94% of £5M turnover = £47,000
Leak 3 total: ≈ £47,000 a year.
The total: ≈ £119,000 a year
£24,000 + £48,000 + £47,000 = £119,000, on £5M of turnover. That is 2.38% of revenue. Put it against profit rather than sales and it lands harder: at a 5% net margin this business makes £250,000 on £5M, so the leak is very nearly half of it.
Only £24,000 of it appears anywhere. That is the subscription, and it is the one the board asks about — which is why the conversation about outgrowing a platform is almost always held about the smallest of the three numbers. The £48,000 is buried inside five salaries that would be paid anyway; nobody has ever written “manual export” on a payslip. The £47,000 is split between contribution that was never earned so was never recorded, a courier bill that reads as ordinary despatch cost, and £130,000 of stock that looks like prudent inventory management until you ask what it is actually there for. None of it has a line on the profit and loss account, which is precisely why an operation carries it for five years while everyone in the building is competent and nothing is on fire.
Where these numbers come from
Every input above is either an internally consistent assumption stated in full, or it is anchored to a published source. Here are the anchors.
- How the licence scales. The Linnworks pricing page confirms three structural facts used in Leak 1: plans are “priced on order volume, not revenue”, advanced functionality is sold as separate add-on modules, and onboarding is a one-off fee sized to the package. It does not publish tier prices, which is the honest reason Leak 1 is built as a stated band — published pricing indicates the model, not the number.
- The £20/hour rate. ONS Annual Survey of Hours and Earnings, April 2025 puts median gross hourly pay excluding overtime for UK full-time employees at £19.67. Leak 2 uses £20 flat rather than loaded. Adding employer National Insurance and pension would put the real figure nearer £22–£24, so the 1,400 hours are charged at the conservative end deliberately.
- Why the buffer exists. Amazon’s Order Performance programme policy sets an Order Defect Rate threshold of under 1% and a Cancellation Rate threshold of under 2.5%, with selling privileges at risk above either. eBay’s seller standards policy caps transaction defects at 2% and explicitly counts an unexpected out-of-stock cancellation as a defect. Those thresholds are why a seller at this volume pads stock rather than risks the metric — the buffer in Leak 3 is a rational response to published marketplace policy, not carelessness.
- The 14% holding cost. Annual inventory carrying cost is widely put at 20–30% of inventory value once capital, storage, insurance, shrinkage and obsolescence are counted. Leak 3 applies 14%, below the bottom of that range, on the basis that fast-moving buffer stock carries less obsolescence risk than the catalogue average. At 20% the total rises by about £7,800.
All figures are in sterling; no source used here was published in another currency, so no conversion was required. Where a figure is a band rather than a quoted price, it is stated as a band.
What closing it looks like
- The morning export stops existing. Not “gets faster” — stops. When the stock record is one record every channel reads from, there is nothing to reconcile at 8am, and the 345 hours a year spent checking one system against another have nowhere to go back to.
- Wholesale orders stop being typed. A PDF or email order becomes a line in the same order book as a marketplace order, priced on the customer’s own terms, without a human reading it out to a keyboard. That is the whole of the 230 hours, and usually the first thing to land.
- The buffer comes down instead of the cancellation rate going up. One authoritative stock figure with reservations against it makes available-to-promise a real number rather than an optimistic one, so the padding stops being the safety mechanism. The £130,000 does not vanish overnight, but it stops being load-bearing.
- The renewal conversation changes shape. Growth stops being the thing that increases the bill. An owned operations system costs what it costs to run whether you do 8,000 orders a month or 20,000 — the real argument in Linnworks vs a custom system, and the reason this decision usually gets made at a volume ceiling rather than after a bad experience.
- Payback, honestly. An operation this shape is a Growth System build, not a Starter Fix. Against a £119,000 annual leak it typically pays back inside the first year on Leaks 2 and 3 alone — but only if the migration is finished and the old spreadsheets are actually retired. Run in parallel with the exports still happening and you have bought a second system, not replaced the first. Anyone promising a painless transition is selling something; the realistic sequence is set out in leaving Linnworks.
FAQ
Is this a real client?
No. It is a representative worked example built from patterns common to multi-channel operations of this size, not a named customer, and nothing here is a case study. Every input — hours, rates, order volumes, error rates, holding cost — is stated in the open so you can substitute your own figures and re-run it. If your numbers produce a smaller total, that is a useful answer too.
Is the £24,000 licence figure what Linnworks actually charges?
It is a modelled figure, not a quote. Linnworks does not publish tier prices — its pricing page confirms only that plans scale with order volume, that advanced functionality is bought as add-on modules, and that onboarding is a one-off fee. So Leak 1 is built from a stated band for an operation at roughly 8,300 orders a month with two modules. Your actual figure is on your renewal paperwork, and it is the one input here you do not have to estimate.
Doesn’t this just mean we should move to a cheaper platform?
Sometimes, and if so the honest move is a straight comparison rather than a rebuild. But note the arithmetic: the licence is 20% of the total. Swapping to a cheaper hub with the same architecture reduces Leak 1 and leaves Leaks 2 and 3 broadly intact, because the exports and the sync window are functions of how the operation is shaped, not of who invoices you. The businesses that get all £119,000 back are the ones too messy for spreadsheets and not ready for a full ERP, that put in a right-sized operations system fitted to the actual flow — two sites, kits, a wholesale book, five channels — rather than the nearest available product.
At what point is a business genuinely outgrowing its platform?
Less usefully measured in order volume than in workarounds. The signal is when exports, side spreadsheets and manual corrections stop falling after each configuration change and start rising with growth instead. At that point the platform is no longer the system of record; it is one input into a system of record living in Excel and five people’s heads.
Run the same maths on your operation
The defaults reproduce the worked example above exactly — same formulas, nothing hidden. Move them to your own figures and every line recomputes.
- Platform cost at the top tier£24,000
- Workarounds, exports and re-entry£48,000
- Sync lag, oversells and manual fixes£47,000
Each leak = (hours a year × team size ÷ 5 × hourly cost) + (revenue × that leak's share). Hours scale with the admin team, the rest with turnover. Illustrative, and deliberately simple enough to argue with.
The Tier Ceiling Worksheet
The same breakdown as a one-page PDF — the figures, the maths, and the assumptions behind them. No email needed.
Download the PDF (free) ↓The full cost model
The full model: every line item, the sensitivity ranges, and the worksheet to run it on your own numbers. We email it to you — one confirm click, unsubscribe anytime.