
The Cost of Not Knowing Your Job Margin: A £3M Job Shop, Priced
£84,000 a year, on the numbers below
A £3M-a-year made-to-order engineering firm with four people quoting and costing around 220 jobs a year loses roughly £84,000 annually to job margin it cannot see until weeks after the job ships. This breakdown prices the three leaks and shows all of the arithmetic.
- Vertical
- Made-to-order engineering
- Revenue
- £3M / yr
- Team
- 4 people quoting and costing
- Volume
- ~220 jobs a year
- Stack
- Sage 50 + estimating spreadsheets + paper job cards
How to read this. This is a worked example of a representative operation — not a named client. Every figure is a transparent calculation you can re-run against your own numbers. No testimonials, no invented results.
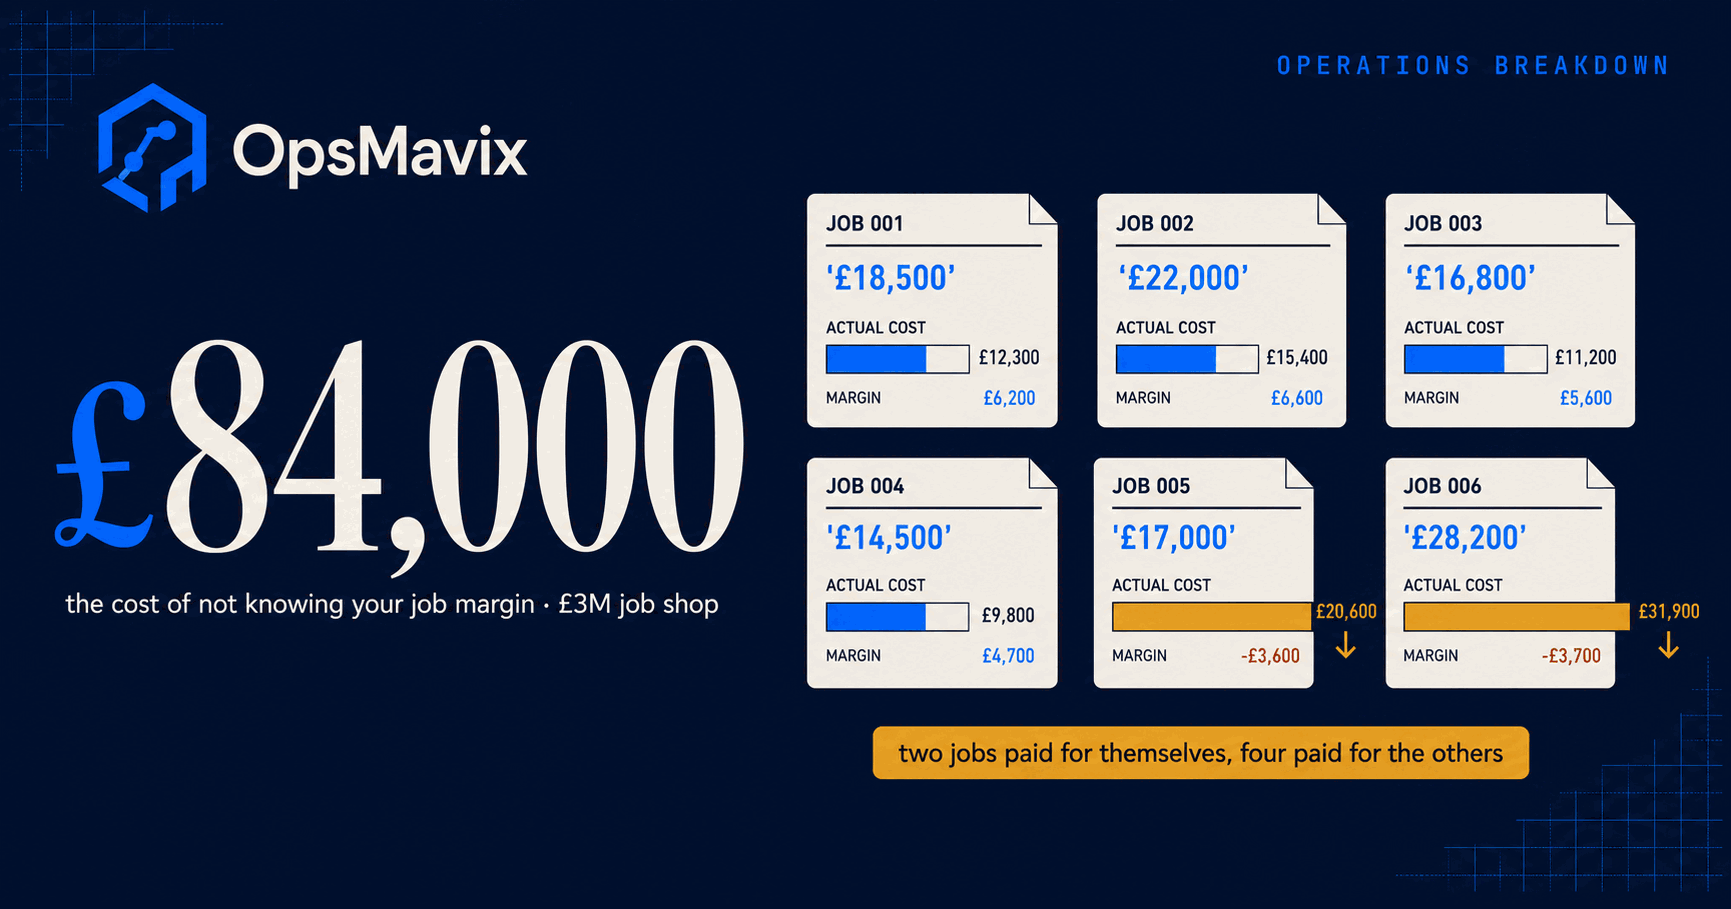
Quick summary: A £3M-a-year made-to-order engineering firm — four people quoting and costing, around 220 jobs a year, costs reconciled monthly — leaks roughly £84,000 a year because true job margin only becomes visible weeks after the job has left the building. The three leaks are rebuilding costs after the fact (≈ £20,000), jobs quoted below their true cost (≈ £36,000), and unbilled extras and materials (≈ £28,000).
The setup
The firm machines and fabricates to drawing. Most work arrives as an enquiry with a drawing pack attached, gets estimated in a spreadsheet that has been extended by three different people over nine years, and goes out as a fixed-price quote. Jobs run from £2,000 to £60,000, averaging just under £14,000. Four people touch quoting and costing: two estimators, a works manager who prices the awkward ones, and the finance manager who reconciles everything at month end. Time is booked on paper job cards collected from the shop floor at the end of each week. Materials are matched to jobs from purchase invoices when they land, which is usually two to six weeks after the steel arrived.
Nothing is visibly broken. Jobs ship, customers pay, the year-end accounts show a profit, and the order book is healthy. That is precisely why the leak survives: a job that came in 4% below its quoted cost base looks identical, on the shop floor and in the bank, to one that came in 4% above. The error is only visible in the reconciliation, the reconciliation happens weeks later at an aggregate level, and by then the next three quotes for similar work have already gone out priced from the same assumptions. If you want the mechanics of the underlying discipline rather than the price of skipping it, we cover those separately in what is job costing and manufacturing job costing.
1Rebuilding job costs after the fact — ≈ £20,000
The costing is not missing. It is scattered. Labour is on paper cards in a tray, materials are on supplier invoices in Sage, subcontract is on a separate purchase ledger, and the link between all three and a job number depends on somebody having written the job number down correctly. So every time the business wants to know what a job actually cost, somebody rebuilds it. Month end is the big one: the finance manager and one estimator spend most of two days pulling cards, matching invoices, chasing the three suppliers who never quote a job reference, and assembling something close enough to book.
The rest of the year it happens one job at a time. A customer queries a price, a repeat enquiry comes in for something similar, the works manager wants to know why job 4412 felt tight — and each of those costs an hour of digging. None of this appears anywhere as a cost. It shows up as four experienced people being busy.
- Month-end job-cost reconciliation: 2 people × 8 hours × 12 months = 192 hours
- Chasing missing job cards, dockets and unreferenced supplier invoices: 3 hours per week × 46 working weeks = 138 hours
- Rebuilding a single job’s cost on request: 170 requests a year × 1 hour = 170 hours
- Total: 192 + 138 + 170 = 500 hours a year
- At a loaded cost of £22/hour: 500 × £22 = £11,000
- Decisions priced from stale cost history — quotes going out before last month’s actuals are in: 0.30% of £3,000,000 turnover = £9,000
That second line is the honest part of the estimate. It is the same mechanism as Leak 2 seen a month late, so we deliberately hold it to a quarter of the Leak 2 rate rather than double-counting it.
Leak 1 total: ≈ £20,000 a year.
2Jobs quoted below their true cost — ≈ £36,000
This is the expensive one, and it is expensive because it compounds. The estimating spreadsheet carries a machine rate, a labour rate and a materials uplift that were last reviewed properly two years ago. Nothing in the process ever compares a quoted cost against the actual cost for that specific job, so nothing ever corrects the rates. When a job runs long, the overrun is absorbed into a monthly gross-margin figure that still looks acceptable at aggregate level. The next quote for similar work is then built from the same rates that just failed.
The pattern shows up in the work you win most easily. Jobs where the estimate is a little light are the jobs that get accepted, because the price was attractive. Jobs priced correctly get shopped around. Over a year the mix drifts towards the work you price worst — which is why “we’re busier than ever and margin is flat” is such a common description of this failure.
- Average job value: £3,000,000 ÷ 220 jobs = £13,636
- Share of jobs landing below their quoted cost base: 30% → 220 × 0.30 = 66 jobs
- Average shortfall on those jobs: 4% of job value → £13,636 × 0.04 = £545
- 66 jobs × £545 = £35,970, call it £36,000
- Cross-check: £36,000 ÷ £3,000,000 = 1.2% of turnover
A 4% shortfall is not incompetence. AACE International’s estimate classification system puts even a Class 1 check estimate — the most detailed class, built on a full take-off — at a low-side accuracy of −3% to −10%. A 4% miss on 30% of jobs is what a competent estimating function looks like without a feedback loop. The loop is the missing part, not the skill.
Leak 2 total: ≈ £36,000 a year.
3Unbilled extras and materials — ≈ £28,000
Made-to-order work changes. The customer sends a revised drawing, the fit-up needs an extra bracket, the material spec moves from mild steel to stainless, a delivery gets split into two. Some of that is chargeable. Whether it gets charged depends on whether anyone recorded it against the job at the time, and whether the person raising the invoice knows about it three weeks later.
In this operation the record lives in an email, a note on a job card, or the works manager’s memory. Roughly one job in six ships with something chargeable on it that never reaches an invoice — not because anyone decided to absorb it, but because by invoicing day nobody can evidence it and nobody wants to open an argument with a customer over £600. There is also a running time cost in the arguing itself: the “was that chargeable or not?” conversation, the month-end check of work in progress against what has actually been billed, and the evidence hunts when a customer disputes an extra that did get charged.
- Jobs shipping with an unbilled chargeable extra: 1 in 6 of 220 jobs = 36 jobs
- Average value of the unbilled extra: £625
- 36 × £625 = £22,500 (0.75% of turnover)
- “Was this chargeable?” digging: 220 jobs × 0.5 hours = 110 hours
- Month-end WIP-versus-invoiced check: 2 people × 4 hours × 12 months = 96 hours
- Evidence hunts on disputed extras: 1 hour per week × 46 weeks = 46 hours
- Total 252 hours, call it 250 hours × £22 = £5,500
- £22,500 + £5,500 = £28,000
One job in six is a conservative reading. PMI’s 2018 global survey found 52% of projects experienced scope creep or uncontrolled change to scope; we are assuming only 17% of jobs both change and lose the charge.
Leak 3 total: ≈ £28,000 a year.
The total: ≈ £84,000 a year
£20,000 + £36,000 + £28,000 = £84,000, on £3M of turnover. That is 2.8% of revenue.
Not one pound of it appears as a line on the P&L. There is no “rebuilt job costs” expense code, no “quoted too low” account, no “extras we forgot to bill” credit note. The labour cost is already in the wage bill for people who were going to be paid anyway. The under-quoting shows up as slightly thinner gross margin, spread evenly across 220 jobs so that no single one looks wrong. The unbilled extras show up as revenue that simply never happened, and you cannot see the absence of an invoice.
Set against context: ONS puts the net rate of return for UK manufacturing companies at 11.7% in 2024 — and that is profit measured against the capital tied up in the business, not against turnover, so it is not a margin you can apply to the £3M. Read the other way round it is still useful. Earning an extra £84,000 the ordinary way, at that rate of return, would mean putting roughly £84,000 ÷ 0.117 ≈ £718,000 of additional capital to work. Closing the leak produces the same figure with no new capital at all: no new customers, no new machines, no price rise.
That invisibility is the reason it runs for years rather than months. A leak that produces no alert produces no action.
Where these numbers come from
Every calculation above is redoable on paper. These are the external benchmarks behind the inputs, so you can argue with the assumptions rather than take them on trust. No figures needed currency conversion — all sources below are UK or percentage-based.
- £22/hour loaded labour cost. ONS reports median gross hourly earnings excluding overtime for full-time employees at £19.67 in April 2025 (Employee earnings in the UK: 2025). Adding employer Class 1 National Insurance at 15% (gov.uk contribution rates) brings that to about £22.60 before pension. Estimators and finance managers sit above the median, so £22 is deliberately conservative for this team.
- A 4% average shortfall on under-quoted jobs. AACE International Recommended Practice 18R-97 sets typical accuracy ranges by estimate class: a Class 2 control or bid/tender estimate at −5% to −15% on the low side, and a Class 1 check estimate at −3% to −10% (18R-97, Table 1, PDF). A 4% miss is inside the tightest band in the standard.
- One job in six carrying an unbilled extra. PMI’s 2018 global project management survey found 52% of projects completed in the prior 12 months experienced scope creep or uncontrolled change to scope (Pulse of the Profession 2018, PDF, p.7). Assuming a third of changed jobs lose the charge gives roughly 17% — the 1-in-6 used above.
- Why £84,000 matters at £3M. ONS records the net rate of return for the UK manufacturing sector at 11.7% in 2024, rising to 11.8% in Q2 2025 (Profitability of UK companies). ONS defines the rate of return as profit as a percentage of the capital used in production — a return on capital employed, not a margin on turnover. It is therefore not applied to the £3M anywhere above. It is used only to size what £84,000 would cost to earn conventionally: about £718,000 of extra capital put to work.
Where a number could not be grounded in a published source — the 500 hours, the 170 rebuild requests, the £625 average extra — it is stated as an assumption you can substitute, not dressed up as a statistic. Swap your own figures into the calculator below and the total moves with them.
What closing it looks like
The fix is not a bigger spreadsheet and it is not an ERP implementation. It is a right-sized operations system that captures cost against the job at the moment it is incurred, and shows quoted against actual before the next quote goes out. What stops happening:
- Month end stops being a reconstruction. Job costs are already assembled, because time and material were booked to the job when they happened rather than reassembled from paper six weeks later.
- Quotes stop being priced from memory. Every estimate is built against the actual cost of the last comparable job, so the rates correct themselves instead of drifting for two years.
- Extras stop evaporating. A change recorded against the job at the point it is agreed becomes a line on the invoice automatically, with the evidence attached if the customer queries it.
- “How did that job do?” becomes a two-second answer. Not a two-hour dig, and not a question people stop asking because the answer is too expensive to get. This is the same shift covered in track project profitability without spreadsheets.
- On payback, honestly: a system at this scale sits in our £10k–£25k Growth band. Against an £84,000 annual leak it clears its cost inside the first year if you recover a third of it — but the recovery is not automatic. It depends on the estimating rates actually being updated from the feedback the system produces. The system makes the correction possible; it does not make it for you.
FAQ
Is this a real client?
No. It is a representative worked example built from a common operation profile — made-to-order engineering, £3M, four people quoting, ~220 jobs a year. OpsMavix does not publish client figures or invent them. Every input and every calculation is shown above precisely so you can re-run it against your own numbers and disagree with ours.
Our margin looks fine at year end. Doesn’t that mean there’s no problem?
An aggregate margin cannot show you a distribution. If 30% of jobs come in 4% light and the rest come in on target, the blended figure moves by roughly one point — well inside the noise you would attribute to material prices or mix. The leak hides in the average. You only see it when you compare quoted against actual per job, which is exactly the comparison this operation never makes.
We already have accounting software. Isn’t job costing part of that?
Most accounting packages will hold a job code and let you post costs against it. What they generally will not do is capture shop-floor time and material consumption at source, flag a job trending over its quoted cost while it is still running, or feed actuals back into the next estimate. That gap is what the market calls job costing software, and it is why the reconciliation still happens in a spreadsheet at month end.
Which leak should we close first?
Leak 1, even though it is the smallest. Capturing time and materials against the job at source is the prerequisite for the other two — you cannot correct estimating rates or evidence an extra without a trustworthy actual cost. It is also the one that returns visible hours to four people in the first month, which is what keeps the change alive.
Run the same maths on your operation
The defaults reproduce the worked example above exactly — same formulas, nothing hidden. Move them to your own figures and every line recomputes.
- Rebuilding job costs after the fact£20,000
- Jobs quoted below true cost£36,000
- Unbilled extras and materials£28,000
Each leak = (hours a year × team size ÷ 4 × hourly cost) + (revenue × that leak's share). Hours scale with the admin team, the rest with turnover. Illustrative, and deliberately simple enough to argue with.
Job Margin Leak Worksheet
The same breakdown as a one-page PDF — the figures, the maths, and the assumptions behind them. No email needed.
Download the PDF (free) ↓The full cost model
The full model: every line item, the sensitivity ranges, and the worksheet to run it on your own numbers. We email it to you — one confirm click, unsubscribe anytime.