
The Cost of Manual Order Entry: A £4M Homeware Brand, Priced Line by Line
£103,000 a year, on the numbers below
A £4M personalised-homeware brand selling on Shopify, Amazon and Etsy, run by seven people on an accounting package and three spreadsheets. Nothing is on fire, and nobody is doing anything wrong — yet manual order entry and the workarounds around it cost roughly £103,000 a year. Every figure is shown so you can re-run it against your own numbers.
- Vertical
- Personalised homeware
- Revenue
- £4M/yr
- Team
- 7 people
- Channels
- Shopify, Amazon, Etsy
- Stack
- Xero + 3 spreadsheets
How to read this. This is a worked example of a representative operation — not a named client. Every figure is a transparent calculation you can re-run against your own numbers. No testimonials, no invented results.
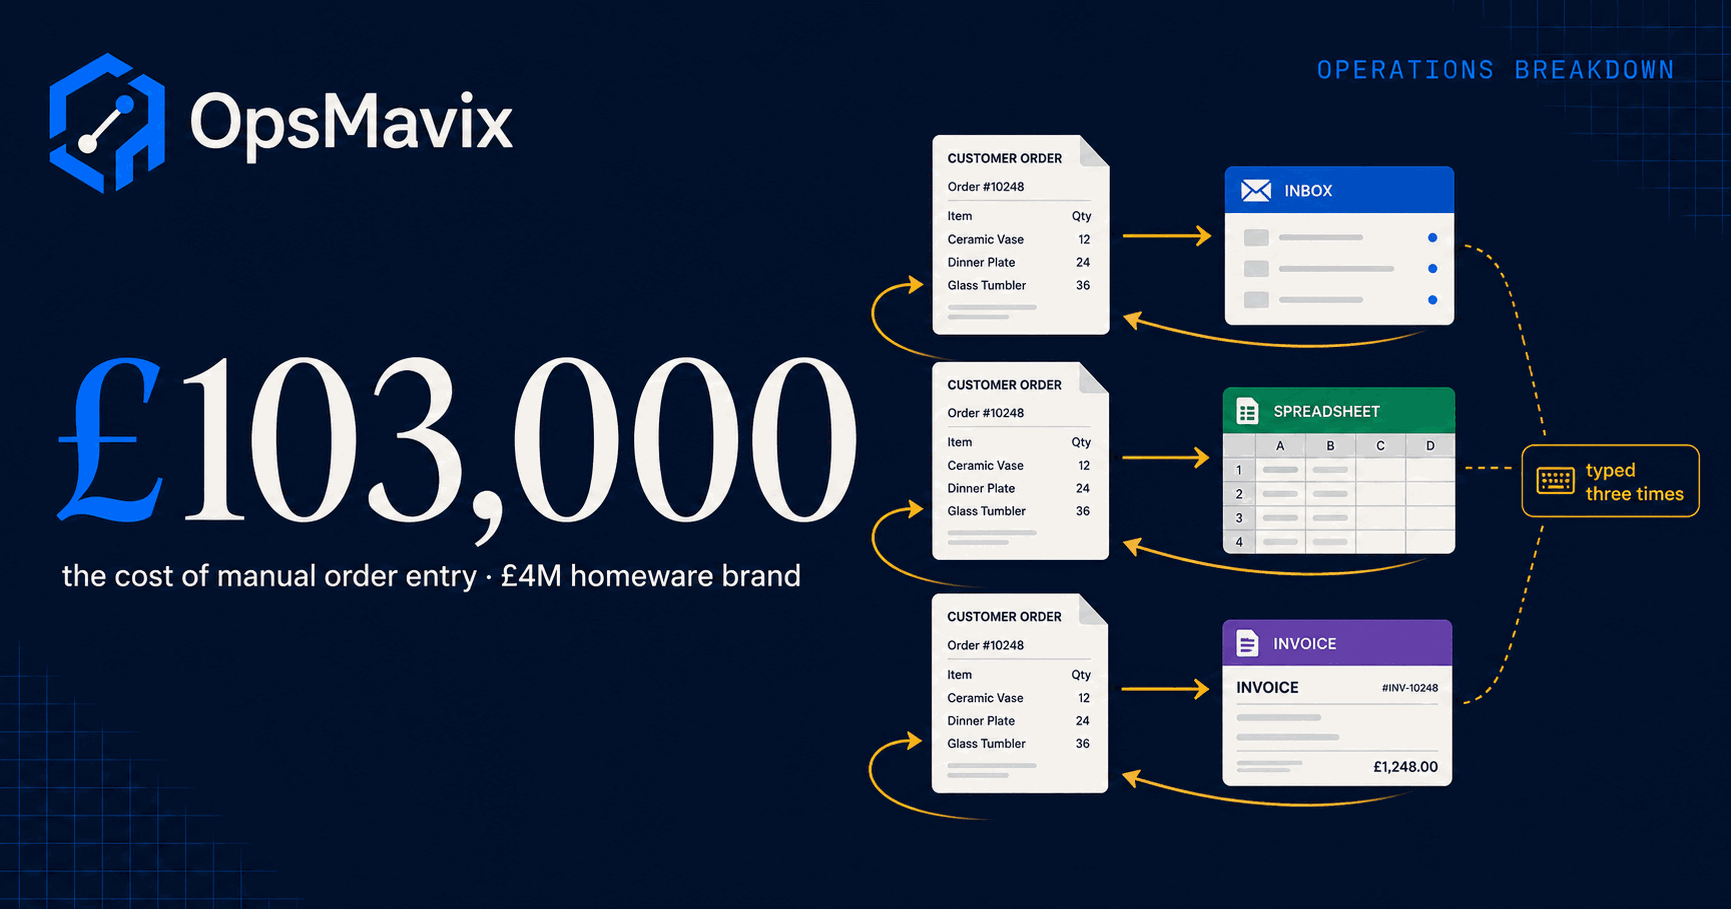
Quick summary: A £4M personalised-homeware brand with seven staff, selling across Shopify, Amazon and Etsy on top of Xero and three spreadsheets, loses roughly £103,000 a year to manual order entry and the workarounds built around it. That figure is the sum of three leaks — £38,400 in re-keying and keying errors, £30,600 in a fragile spreadsheet, and £34,000 in having no live view of stock — each priced below with the arithmetic shown.
The setup
Seven people. A founder who still approves the awkward orders, one who runs the studio, two on production, two part-time on packing, and one person — call her the operations coordinator — who holds the middle together. Orders arrive from the Shopify store, Amazon Seller Central and Etsy. Trade orders arrive by email as PDFs and, twice a month, as a photographed order form from a garden-centre buyer who has never used a portal in his life. Personalisation details — a name, a date, a font choice — arrive in a free-text field nobody has managed to constrain.
Every order gets typed at least twice and often three times: once into the production sheet so the studio knows what to engrave, once into the picking list so packing knows what goes in the box, and once into Xero so it gets invoiced. Nothing about this looks broken. The orders ship. The customers are happy. Xero reconciles. The coordinator is good at her job and the errors that do slip through get caught before most of them reach a customer. That is precisely why the leak survives: there is no incident, no outage, no angry board meeting. There is only a workload that has quietly grown with revenue, absorbed by people who assume this is simply what running a growing brand feels like. Nobody has ever put a number on it — so nobody has ever had to defend it.
1Re-keying the same order three times — ≈ £38,400
The coordinator starts at about 8:15 with the overnight Shopify and Etsy orders, then pulls Amazon separately because the export format is different. Trade PDFs are read and typed by hand. Each order gets a row in the production sheet, a line on the picking list, and eventually an invoice in Xero. On a normal day that is two hours of her morning. It is also two hours of somebody else’s, because one person cannot absorb the volume: the founder takes the trade PDFs and the awkward ones, and the studio lead retypes personalisation detail into the production sheet before the benches start. In the eight weeks before Christmas it is considerably more than that for both. Averaged across the year it is two people, two hours a day, moving order data from one place to another.
The typing is only half the cost. The other half is what happens when a digit moves. A wrong quantity means a second production run. A misspelled personalisation on an engraved item means a full remake, because the product cannot be resold. A wrong address means a re-ship at the brand’s expense. None of it shows up as a cost line — the remake is absorbed into materials, the re-ship into postage, the extra hour into a longer day.
- 2 people × 2 hrs/day × 5 days × 46 working weeks = 920 hours a year of pure order entry
- 920 hrs × £20/hr loaded cost (salary plus employer NI and pension) = £18,400 in time
- Keying-error tax: assume 1% of orders carry a material entry error — the optimistic end of published manual order-entry error rates of 1–3%
- 1% of £4,000,000 of order value = £40,000 of order value passing through a mistake (errored orders taken at average order value)
- Not all of that value is lost — most errors are caught, and the cost is the remake, re-ship, credit or discount rather than the whole order. Attribute a conservative half to the re-keying step itself = £20,000
- £18,400 + £20,000
Leak 1 total: ≈ £38,400 a year — before anyone has lost a customer over it.
That error tax is an attribution, not a measurement: half of the modelled error value is assigned to re-keying and the rest to everything else that touches an order. It is also deliberately low — a personalised-goods brand has a worse-than-average error economy, because a misspelled name is not returnable stock, it is scrap. The structural fix is not faster typing; it is removing the transcription step altogether.
2The spreadsheet only one person understands — ≈ £30,600
There are three spreadsheets, but only one matters. It is the stock and ordering sheet: 11 tabs, a pivot table nobody rebuilds, three VLOOKUPs pointing at a tab that was renamed in 2024 and now silently returns the wrong supplier lead time for two SKUs. It was built by the coordinator over four years. It works. It also cannot be handed to anyone else, because the logic lives in her head rather than in the file, and because two of the tabs are held together by manual paste-over every Monday morning.
The direct cost is the maintenance: the Monday reconcile, the month-end catch-up, the twenty minutes lost every time a formula returns something that is obviously wrong and has to be traced. The larger cost is downstream. Purchase decisions are made off this sheet. When the sheet is a week stale — and it usually is, because it is updated in batches rather than continuously — the brand orders the wrong quantity of blanks, pays for an expedited top-up on a line that sold faster than the sheet knew, or commits cash to a line that had already stopped moving. Each individual decision looks fine. In aggregate they cost a fraction of turnover every year.
- Maintaining and reconciling the sheet: 5 hrs/week × 46 weeks = 230 hours a year
- 230 hrs × £20/hr = £4,600 in time
- Ordering on stale figures: assume 0.65% of turnover is lost to over-ordering, expedited top-ups, and margin given away clearing what should not have been bought
- 0.65% of £4,000,000 = £26,000
- £4,600 + £26,000
Leak 2 total: ≈ £30,600 a year — and a business that cannot let one person take a fortnight off in peak season.
The 0.65% is the softest number in this breakdown and it is worth saying so plainly. It is not measurable from the outside; it is inferred from what the sheet is used to decide and how out of date it typically is. If your buying is monthly and low-variance, it will be lower. If you buy weekly against fast-moving seasonal lines, it will be higher. The controls that would make a sheet this important safe — locked inputs, version history, an audit trail, a second pair of eyes on every formula change — are exactly the ones no seven-person team has time to maintain.
3No live view of stock and orders — ≈ £34,000
Ask the question “how many of SKU 4471 can we promise for Friday?” and there is no single place to answer it. Shopify knows what it thinks it has. Amazon knows what it has allocated. The production sheet knows what is part-made. The blanks in the stockroom are counted properly once a quarter. The answer is assembled by walking to the shelf, which is fine at 40 orders a day and impossible at 140.
This shows up in two directions at once. Upward: the best-selling personalised line goes unavailable on Etsy for four days in October because the blanks ran out and nobody saw it coming, and the listing loses ranking on top of the lost orders. Downward: 40 boxes of a discontinued colourway sit under the bench for eighteen months, holding cash and shelf space, until they are cleared at cost. Both are the same missing thing — a current, trustworthy picture of what exists and what is already committed.
- Stockouts on fast lines: assume 0.45% of turnover in orders that could not be taken or were cancelled
- 0.45% of £4,000,000 = £18,000 in lost contribution and demoted listings
- Dead and slow stock: assume 0.40% of turnover tied up in stock that will be cleared at or below cost, plus its carrying and storage cost
- 0.40% of £4,000,000 = £16,000
- Combined: 0.85% of £4,000,000
- £18,000 + £16,000
Leak 3 total: ≈ £34,000 a year — the leak you can feel but cannot point at.
Nobody here would call this a stock problem. They would say “October was messy” and “we bought too many of the teal ones” — the same sentence written twice. The fix is not more counting; it is a stock record that updates as orders and production move, so the number on the screen is the number on the shelf.
The total: ≈ £103,000 a year
£38,400 + £30,600 + £34,000 = £103,000.
That is about 2.6% of turnover, and roughly the fully loaded cost of two and a half people, going out of a seven-person business every year.
Not one pound of it appears as a line on the P&L. The 920 hours are already inside salaries that were going to be paid anyway. The remakes sit in materials. The re-ships sit in postage. The over-ordering sits in stock, which is an asset until the day it is written down. The stockouts are revenue that never arrived, and revenue that never arrived has no ledger entry at all. Every one of these costs is real, and every one of them is invisible to the only report the business actually reads each month.
That invisibility is the mechanism. A cost that shows up as a line gets challenged eventually. A cost that shows up as tiredness, or as “we just need another pair of hands”, gets hired around instead of fixed — and it grows with revenue rather than shrinking.
Where these numbers come from
Every input above is either stated as an assumption you can change, or anchored to a published benchmark. Here are the anchors, converted to pounds at roughly £1 = 1.33 US dollars.
- The £20/hour loaded rate. ONS Annual Survey of Hours and Earnings reports median gross hourly earnings excluding overtime for UK full-time employees at £19.67 an hour in April 2025 (ONS, Employee earnings in the UK: 2025). Order-entry work usually sits below the median in gross pay, but the loaded cost adds employer National Insurance and pension on top, so £20 is a reasonable middle and, if anything, slightly conservative for a role that also handles customers.
- Manual order entry costing real money per order. The Institute of Financial Operations figure widely cited in B2B commerce puts the average cost of processing a manual order at roughly £23–£60 per order (converted), against roughly £0.75–£3.75 (converted) for an order placed through an integrated channel (HumCommerce, The Cost of Manual Order Processing). This breakdown does not use a per-order cost — it prices the hours directly, which for a brand of this size lands lower than that benchmark would imply.
- The 1% keying-error rate. APQC benchmarks put the average error rate for manual order entry at 1%–3% (Conexiom, The Real Cost of Manual Order Entry in B2B Operations). Field-level research is stricter: a systematic review and meta-analysis of clinical data processing found a pooled error rate of 0.29% for single data entry per field (Garza et al., Error Rates of Data Processing Methods in Clinical Research). Those are consistent, not contradictory — an order carries a dozen or more fields, so a sub-1% per-field rate produces a per-order rate in the low single digits. Using 1% at the order level is the cautious reading of both.
- The fragile spreadsheet. Powell, Baker and Lawson audited 50 operational spreadsheets in real business use and found that only 7 were free of errors that produced wrong results — a spreadsheet error rate of 86% — with an average cell error rate of 0.87% under their strict definition and 1.79% under their inclusive one (Errors in Operational Spreadsheets, Journal of Organizational and End User Computing, 2009). The point is not that spreadsheets are bad. The point is that an operationally critical sheet is far more likely to contain a wrong number than to not, and buying decisions made on it inherit that.
- Stockouts and overstocks as a share of trade. IHL Group’s inventory distortion research put the global cost of out-of-stocks and overstocks at roughly £1.33 trillion (converted) for 2023, split about £900bn (converted) to out-of-stocks and £420bn (converted) to overstocks (Why Inventory Distortion Costs Retailers Trillions, The Food Institute). Those are global, retail-wide totals, not a rate to drop onto one business. What they establish is that stock distortion is a material share of trade rather than a rounding error. The 0.85% used here is set independently of them and deliberately low, because a seven-person brand watching its own shelves catches more than a global chain does.
The difference between this breakdown and the usual article on the subject is not the sources. It is that the numbers above are inputs to arithmetic you can redo on paper.
What closing it looks like
- The order is entered once. It arrives from Shopify, Amazon, Etsy or an email PDF and lands in one place, from which production, picking and invoicing all read. The 920 hours do not get reduced; they mostly stop existing. See how to stop re-keying orders by hand for what that actually involves.
- Personalisation stops being free text. The engraving detail is captured as structured data at the point of sale, so the studio reads what the customer typed rather than what somebody retyped. Remakes fall because the transcription step is gone, not because people are being more careful.
- The fragile sheet retires. Stock and ordering logic moves somewhere the whole team can read, so the coordinator can take a holiday and the business does not slow down. Nobody has to be the system.
- Stock and commitments are current. What is on the shelf, what is part-made, and what is already promised are visible in one view, so buying runs on today’s position — including proper purchase order tracking instead of a column called “ordered?”.
- On payback, honestly: a right-sized operations system for an operation this size sits in the £10k–£25k range. Against a £103,000 modelled leak that is a first-year payback, and often on leak one alone — but only if the leak is real at your volumes. That is what the audit is for: to find out whether your version of this number is £103,000, £30,000, or nothing worth acting on.
FAQ
Is this a real client?
No. It is a representative worked example, built from the pattern that repeats across brands of this size and stack. No named business, no testimonial, no claimed result. Every input is stated so you can substitute your own hours, rate and turnover and get your own figure — the only one that matters.
The percentages look invented. Are they?
They are assumptions, labelled as assumptions everywhere they appear. The hours and the hourly rate are hard inputs you can check against your own payroll in ten minutes. The percentages — 1% keying errors, 0.65% stale-figure ordering, 0.85% stock distortion — are judgements anchored to the benchmarks listed above and set at the cautious end of each range. If one is wrong for your business, change it in the calculator below; the model is built to be argued with.
Our team is faster than two hours a day. Does the whole thing collapse?
No, it just gets smaller. Halve the hours and leak one drops from £38,400 to £29,200, because the error tax does not move with typing speed — it moves with how many times data is transcribed. That is the more important variable. A team that types quickly but still enters each order three times has a speed advantage and the same structural exposure.
Would an ERP fix this?
It would — and it would cost more than the leak for several years, and take a seven-person team a long way from what they are good at. The gap this business sits in, too messy for spreadsheets and not ready for a full ERP, is where an owned operations system fits: the specific things above, on the tools already in use, without a platform migration. What an operations control system is covers the distinction.
Run the same maths on your operation
The defaults reproduce the worked example above exactly — same formulas, nothing hidden. Move them to your own figures and every line recomputes.
- Re-keying the same order three times£38,400
- The spreadsheet only one person understands£30,600
- No live view of stock and orders£34,000
Each leak = (hours a year × team size ÷ 7 × hourly cost) + (revenue × that leak's share). Hours scale with the admin team, the rest with turnover. Illustrative, and deliberately simple enough to argue with.
Order Entry Cost Worksheet
The same breakdown as a one-page PDF — the figures, the maths, and the assumptions behind them. No email needed.
Download the PDF (free) ↓The full cost model
The full model: every line item, the sensitivity ranges, and the worksheet to run it on your own numbers. We email it to you — one confirm click, unsubscribe anytime.