
Why Your Projects Look Busy but Bleed Money
Your team is fully booked, the calendar is packed — yet the margin disappears by the time the project ends. Here's why, and how to see it in time.
The project finished on time. The client was happy. Then the numbers came in, and the margin had quietly vanished — eaten by hours nobody logged, a scope that crept wider every week, and rework that never made it onto an invoice.
If you run a project-based business — an agency, a consultancy, a studio, a services firm — you know this feeling. Everyone is busy. The calendar is full. But busy and profitable are not the same thing, and by the time a spreadsheet finally tells you the difference, the project is already over and the money is already spent.
That is the real problem with tracking project profitability in spreadsheets: the sheet shows you what already happened, not what is happening right now. To protect your margin you have to see it live — which means learning to track project profitability without spreadsheets, while you can still act.
Key Takeaways
- Busy isn’t profitable — a full schedule can still lose money on underpriced or over-running work.
- Spreadsheets only show margin after a project closes, when it’s too late to fix.
- Unlogged hours, scope creep and rework are where the margin quietly leaks.
- A live dashboard shows margin, utilisation and delays mid-project, while you can still re-scope.
- If you can’t name your least profitable live project in under a minute, the spreadsheet has stopped working.
Related: what a live view looks like in an operations dashboard for a small business, and the wider signs you’ve outgrown manual systems.
1Busy Doesn’t Mean Profitable
A full schedule feels like success. It looks like growth. But a team that is fully booked on the wrong work — underpriced projects, endless revisions, jobs that ran twice as long as quoted — is simply losing money faster.
The danger is that effort hides the leak. Everyone is working hard, so nobody questions whether the work is actually paying. Profitability problems rarely announce themselves; they show up months later as a cash-flow squeeze you can’t quite explain.
2Where Spreadsheets Go Blind
Spreadsheets are fine for a handful of small jobs. As soon as you are running several projects with several people, the gaps open up fast:
- Hours that never get logged — timesheets filled in on Friday from memory, rounded up, or skipped entirely.
- Scope creep — “just one more change” that nobody re-quotes, repeated across a dozen clients.
- Rework — time spent fixing things that should have been right the first time, invisible because it looks like normal work.
- No live picture — the sheet is only as current as the last person who updated it, which is usually never.
Each gap is small on its own. Together they are the difference between a healthy margin and a write-off — and a spreadsheet shows you none of it until the project is closed.
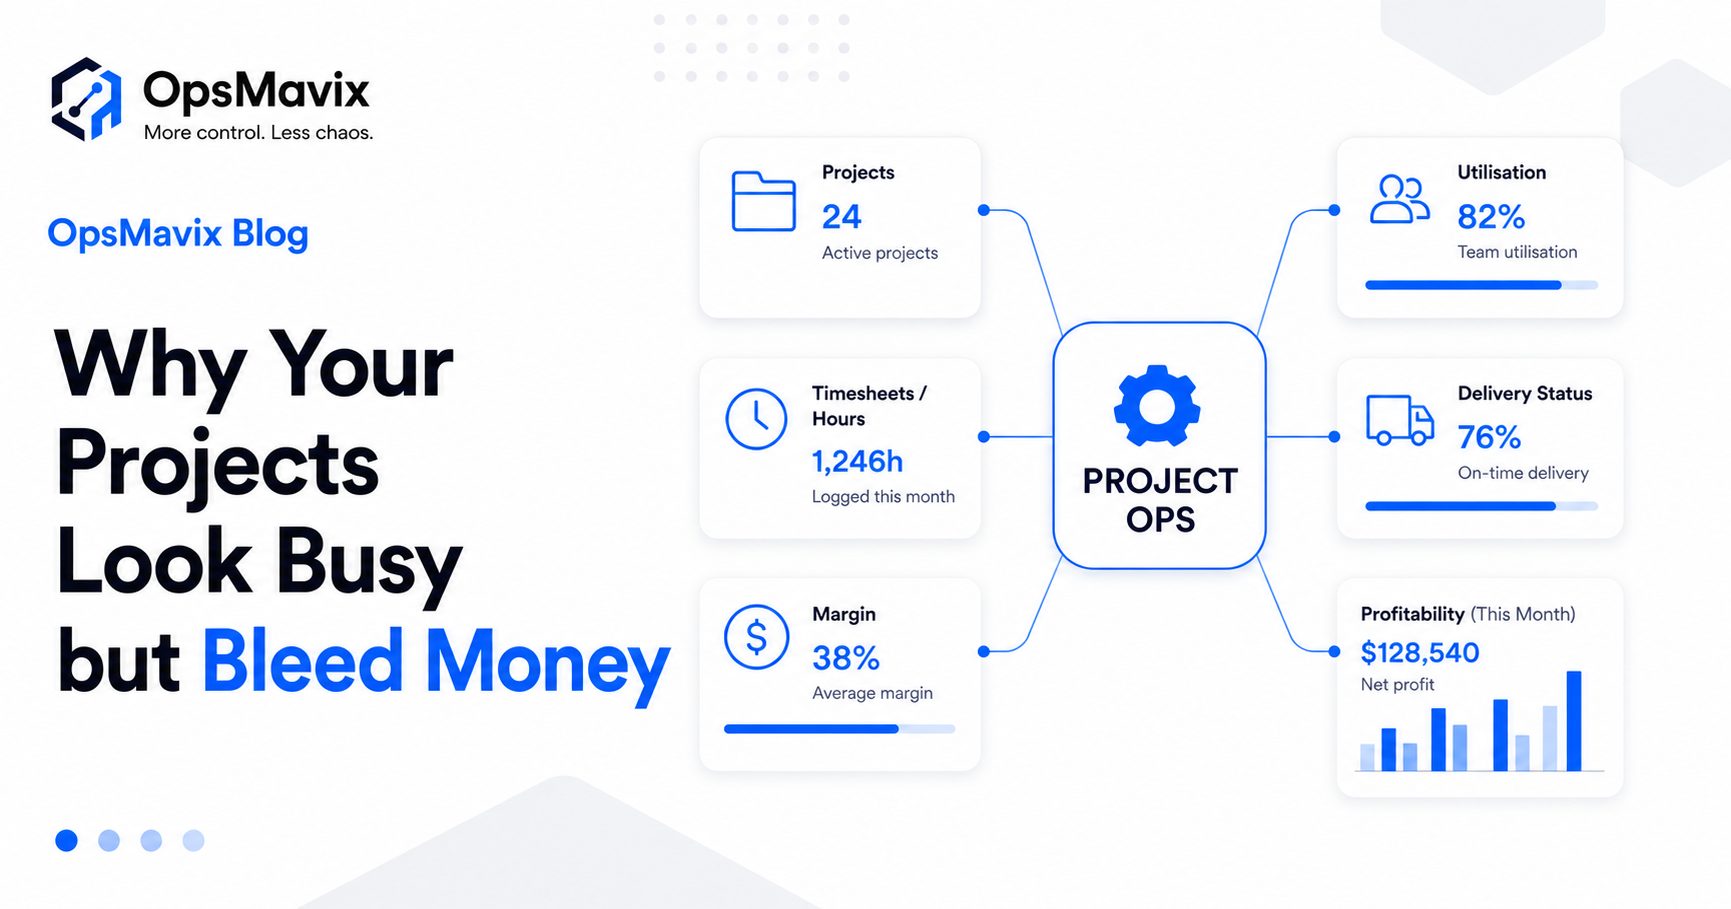
3What a Project Operations Dashboard Actually Shows
A project operations dashboard flips the timing. Instead of reconstructing what happened after the fact, it shows the health of every live project while there is still time to act:
- Margin per project, live — budget versus actual cost as the work happens, not at the end.
- Utilisation — who is over-booked, who has capacity, and where time is actually going.
- Delivery status and delays — which projects are slipping before the deadline arrives.
- Hours against budget — a quiet alarm when a job is burning through its hours too fast.
The point is not more reporting. The point is earlier reporting — seeing a project drift while you can still re-scope it, reassign it, or have the awkward conversation with the client before the loss is locked in.
4Spreadsheet vs a Project Operations Dashboard
| Spreadsheet | Project operations dashboard | |
|---|---|---|
| When you see margin | After the project ends | Live, as work happens |
| Hours | Logged from memory, often late | Tracked against budget in real time |
| Scope changes | Easy to forget to re-quote | Flagged against the original budget |
| Utilisation | Guesswork | Clear per person and per project |
| Reporting | Rebuilt by hand each time | Always current, one source |
The difference isn’t prettier charts. It’s whether you find out about a problem in time to fix it.
5Signs You Can’t Track Project Profitability in Spreadsheets Anymore
You’re probably past the point spreadsheets can keep up if:
- You only learn a project lost money after it’s delivered.
- Two people quote the same numbers differently because they’re using different versions of the file.
- Month-end reporting is a manual scramble that takes days.
- Nobody can tell you, right now, which active project is your least profitable.
- Your team treats timesheets as an afterthought because the data goes nowhere useful.
FAQ
How soon should I be able to tell if a project is profitable?
With live tracking, from day one. You should be able to see budget-versus-actual the moment work starts, rather than waiting for the project to close to find out where it landed.
Do I need an expensive PSA tool to do this?
Not necessarily. Large off-the-shelf platforms can be overkill — heavy, generic, and full of features you’ll never use. A custom dashboard built around how your projects actually run is often simpler to adopt and cheaper to maintain.
Won’t my team resist timesheets?
They resist timesheets that feel pointless. When logging time actually feeds a live view that protects their workload and the company’s margin — instead of disappearing into a void — adoption gets much easier.
Can it connect to our invoicing and approvals?
Yes. The same operational data that tracks profitability can feed your billing and your invoice approval workflow, so hours, costs and invoices all line up instead of being reconciled by hand.
How OpsMavix Can Help
OpsMavix builds custom project operations dashboards for project-based businesses — so you can see margin, hours and delivery status across every live project in one place, in real time, without living in spreadsheets.
If your projects look busy but the profit keeps disappearing, that’s exactly the kind of operational leak we find and fix. Book an Operations Leak Audit and we’ll map where your project margin is actually going.