
Job Costing Examples: Worked Numbers From Print, Construction and Agency Jobs
Three fully worked job costing examples from a print run, a construction job and an agency project. Each one shows the labour, materials and overhead maths, and where the quoted margin quietly disappears in real jobs.
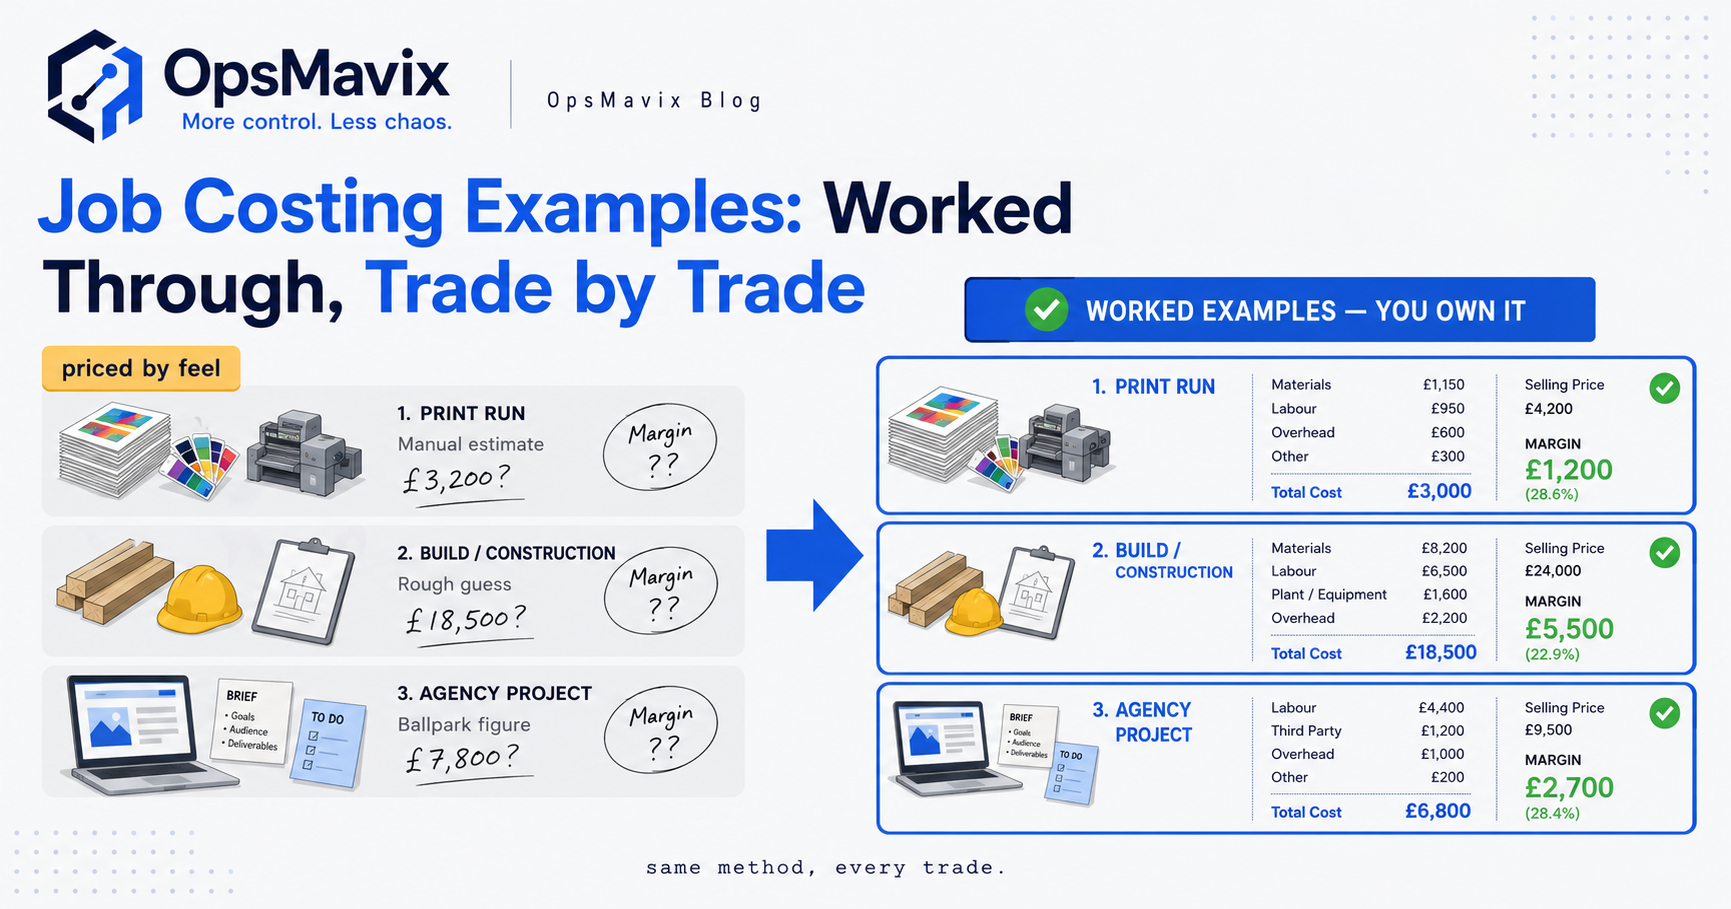
The clearest way to understand job costing is to see it done, so here are three worked job costing examples from very different trades: a print run, a construction job and an agency project. Each one uses the same core method (labour + materials + a share of overhead, compared against what you quoted) but the shape of the cost is different every time, and that is exactly where most businesses get their margins wrong.
If you want the underlying method first, read how to calculate job costing and the plain-English what is job costing explainer. This piece assumes you know the mechanics and instead shows you the numbers on the page, including the parts nobody puts in the original quote.
Key Takeaways
- The method is identical across trades, but the biggest cost line moves: materials dominate print, labour and rework dominate construction, and hidden time dominates agency work.
- Quoted margin and actual margin are different numbers. Every example below finishes lower than it started, and the gap is where the leak lives.
- Overhead is not optional. Skip the overhead share and every job looks profitable while the business quietly loses money.
- Change orders and rework decide the outcome far more often than the original estimate does.
- Small untracked time is the silent killer in services: the hours that never make it onto a timesheet are the hours you gave away free.
- A worked example on paper is a one-off; a live job costing view is repeatable and catches the leak while you can still do something about it.
Example One: A Print Run (Materials-Heavy Manufacturing)
A print shop quotes 5,000 branded brochures at £2,400. Here is the estimate versus what actually happened.
Quoted:
- Paper and board: £520
- Ink and plates: £180
- Machine time (6 hours at £70/hr): £420
- Finishing and binding labour (8 hours at £22/hr): £176
- Overhead allocation (machine-hour based): £300
- Target margin: ~£804 (34%)
Actual:
- Paper and board: £610 (a colour reprint on 800 sheets after a proof error)
- Ink and plates: £180
- Machine time (7.5 hours): £525
- Finishing labour (10.5 hours): £231
- Overhead allocation: £375
- Delivery courier (not quoted): £48
Actual cost: £1,969. Actual margin: £431, or about 18%. The job still made money, but half the planned margin vanished into a reprint and the machine time overrun. Nobody stole the profit; it drained out through one proof error and a courier line that was never in the quote.
This is the classic manufacturing pattern where materials and machine time dominate, and where a small physical mistake has an outsized cost. For the full manufacturing treatment, including work-in-progress and multi-stage runs, see manufacturing job costing.
Example Two: A Construction Job (Labour and Rework Heavy)
A small builder quotes a bathroom refit at £9,800. Construction is where estimates and reality diverge the most, because the ground truth (literally) changes once work starts.
Quoted:
- Materials (tiles, suite, plumbing, plasterboard): £3,200
- Labour: 90 hours at £38/hr = £3,420
- Subcontracted electrician: £650
- Overhead and site costs: £900
- Target margin: ~£1,630 (17%)
Actual:
- Materials: £3,540 (extra plasterboard after damp was found behind the old tiling)
- Labour: 118 hours at £38/hr = £4,484
- Subcontracted electrician: £650
- Waste removal and extra skip hire: £220
- Overhead and site costs: £900
Actual cost: £9,794. The job was quoted at £9,800. Margin: £6. Effectively break-even on a job that looked like a healthy 17% on paper.
The whole margin went into 28 extra labour hours and unplanned damp remediation. One builder told us the pattern plainly: the quote is fiction until the walls are open. That is not an argument against quoting; it is an argument for tracking actual hours against the estimate as the job runs, so a variation gets raised (and charged) instead of absorbed.
The fix here is not a better spreadsheet formula. It is catching the labour overrun at hour 100, not at final invoice, so the variation becomes a change order the client pays for rather than a loss the builder eats.
Example Three: An Agency Project (Hidden-Time Heavy)
A design agency quotes a brand and website project at £14,000 fixed fee. Services work has almost no materials cost, which fools people into thinking it is simple to cost. It is the hardest of the three.
Quoted (based on 140 hours):
- Strategy and design: 70 hours
- Development: 50 hours
- Project management: 20 hours
- Blended rate assumed: £100/hr internal cost basis, billed as fixed fee
- Assumed cost: ~£7,000 (implied ~50% gross margin before overhead)
Actual (from time actually logged, plus the time that never got logged):
- Strategy and design: 88 hours (three extra rounds of revisions)
- Development: 62 hours (a late CMS scope change)
- Project management: 34 hours (client comms ballooned)
- Untracked “quick” tasks nobody logged: an estimated 15+ hours
Logged hours alone: 184, against 140 quoted. Add the untracked time and the real effort is closer to 200 hours. At a £100 cost basis that is roughly £20,000 of cost against a £14,000 fee. That project lost money, and without job costing the agency would have “felt busy and profitable” the entire time.
Operators in agencies tell us the same thing repeatedly: the profit did not leave in one big line, it left in dozens of unbilled scope creeps and “I’ll just quickly do this” moments that never touched a timesheet.
What The Three Examples Have In Common
Look across all three and the same structure appears every time.
- Every job finished at a lower margin than quoted, not because of the estimate but because of what happened after it.
- The biggest risk line was different in each: reprint/materials in print, labour/rework in construction, untracked scope in the agency.
- In all three, the loss was visible in the data long before final invoice, if anyone had been comparing actuals to estimate mid-job.
That last point is the whole game. A worked example on paper is useful for learning. But you cannot manually rebuild these tables for every live job every week; it is exactly the manual, disconnected, spreadsheet-driven work that quietly eats a day and still runs a fortnight behind reality.
Turning Examples Into A Repeatable View
The examples above are static. Your business runs dozens of these at once, all moving. The practical shift is from “we costed that job after it finished” to “we can see estimate versus actual on every open job, today.”
That means job cards where logged hours, purchased materials and allocated overhead flow into one live figure per job, sitting next to the quoted number, with the variance in plain sight. When a construction job crosses its labour estimate at hour 100, it should be visible then, not at invoicing. When an agency project passes its quoted hours, someone should get a nudge to raise a variation. This is precisely what a project operations dashboard is for: the estimate-versus-actual view across every live job, without anyone rebuilding a spreadsheet.
Build, Buy, Or Own The System
You have three honest options. You can build your own job costing spreadsheets, which is free to start and works until you have more than a handful of live jobs, at which point the reconciliation becomes a part-time job in itself and the numbers are always a step behind. You can buy a full ERP with a costing module, which is powerful but often heavier, pricier and slower to configure than a growing business needs, and you end up fitting your jobs to its assumptions.
Or you own a right-sized operations system that does exactly this job for the way your trade actually works: one live estimate-versus-actual view, fed by the hours and purchases your team already records, with no ERP-sized overhead. That is the middle ground most growing businesses actually need, and it is the one nobody sells them.
Whichever route you pick, the test is the same. Take your last three finished jobs and work them the way we did above. If the actual margin surprises you, the problem was never the quote. It was that nobody watched the gap while there was still time to close it.
Keep reading
Getting value from OpsMavix? Add us as a preferred source on Google — you'll see more of our operations content in your AI Overviews, AI Mode and Search.